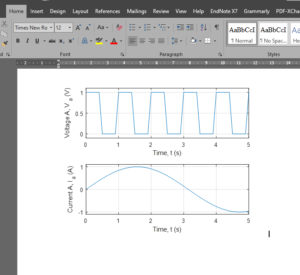
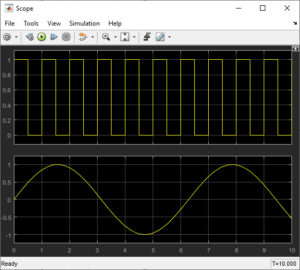
Scope can easily shown you the result of the simuilation. However, it is not clear when the graph from the scope is transfer to the Word document. Here is the step to properly plot graph from Simulink simulation.
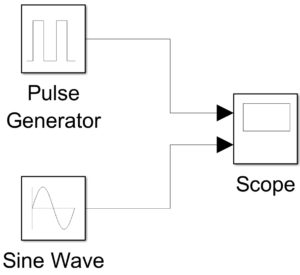
- Add “To workspace” block into the simulation. [Library>Simulink>Sinks>To Workspace]

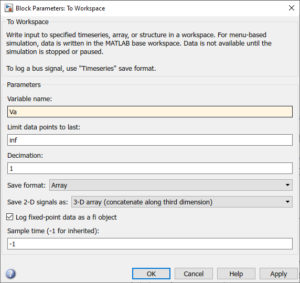
- Change the variable name according to your specification. Change the “Save format” to “Array”.
- Add “Clock” block into the simulation to record the time. [Library>Simulink>Sources>Clock]

- Copy the “To workspace” block to the signal you want to plot. Connect the “Clock” to the “To workspace” block.
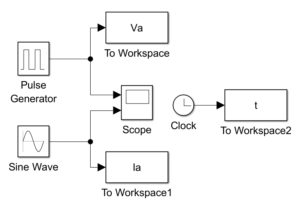
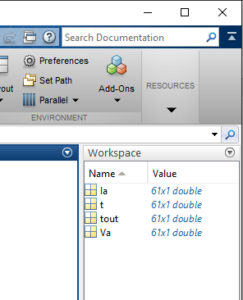
- Run the simulation. All the signals connected to the “To workspace” are now available in the MATLAB Workspace area.
- Open a new script in MATLAB.

- Copy this code:
clc; %To clear command window
close all; %To close all figuresubplot(2,1,1) %Use subplot to do multiple plot
plot(t,Va); %Plot Va against t.
%Va and t taken from workspace
xlabel(‘Time, t (s)’); %Label x-axis
ylabel(‘Voltage A, V_a (V)’); %Label y-axis
grid on; %add grid
xlim([0 5]); %change the range of x-axis
ylim([-0.1 1.1]); %change the range of y-axis
subplot(2,1,2) %Use subplot to do multiple plot
plot(t,Ia); %Plot Ia against t.
%Ia and t taken from workspace
xlabel(‘Time, t (s)’); %Label x-axis
ylabel(‘Current A, I_a (A)’); %Label y-axis
grid on; %add grid
xlim([0 5]); %change the range of x-axis
ylim([-1.1 1.1]); %change the range of y-axis - The figure produced by the script is better compared to the scope.
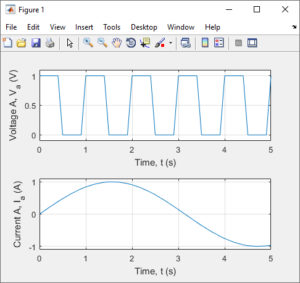
- To transfer the figure to the Word document, adjust the figure to the desired size. Then “Edit”>”Copy Figure”. Paste to Word document.
