For starters, let’s try to plot functions (without data) in Gnuplot.
In a graph, you have the x and y axis.
For Gnuplot, the y-axis is not called “y”… instead, you use a function to define it..
e.g. y = mx + c
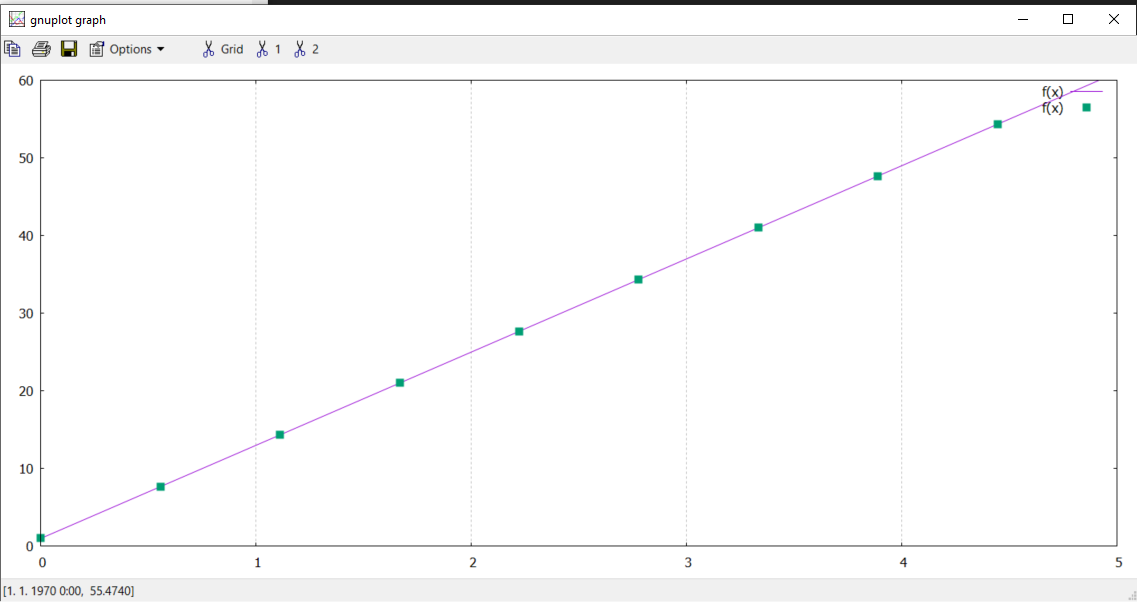
For gnuplot, you will need to write it this way (write this in your script):
# sets the number of points in the entire graph
set samples 10
# this is the function
f(x) = m*x + c
# define the variables that you use
m = 12
# define the variables that you use
c = 1
# this plots the f(x) function with line
plot f(x) with line
# replot f(x) function with points
replot f(x) with points pointtype 5
Sometimes, you will need to set the y-axis and x-axis range. You can use this command.
# this sets the y-axis range from 0 to 10
set xrange [0:5]
# this sets the x-axis range from (all) to 1.5
set yrange [0:60]
Remember that the commands are sequential. So that means, it must appear before the plotting command.
If you change the range after plotting, it will not work.
If it is placed after, then you can replot existing plots using this command:
# this will replot everything plotted previously.
replot
Let’s try a more complicated equation:
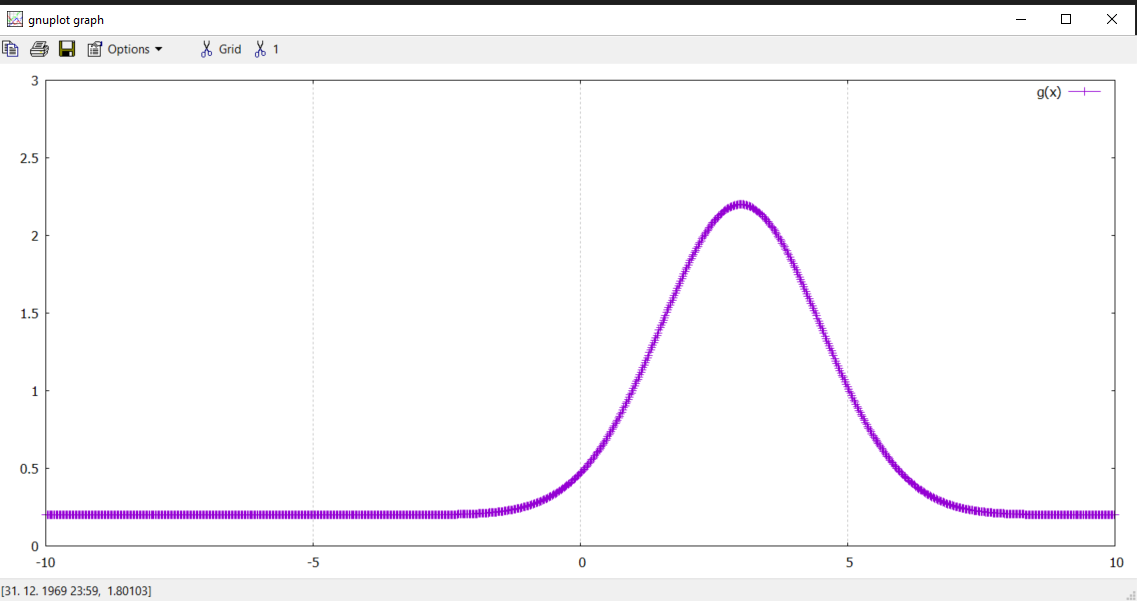
Gaussian Distribution Plot
set samples 1000
g(x) = a*exp((-(x-b)**2)/(2*c**2)) + d
a = 2
b = 3
c = 1.5
d = 0.2
set xrange [-10:10]
set yrange [0:3]
plot g(x) with linespoints
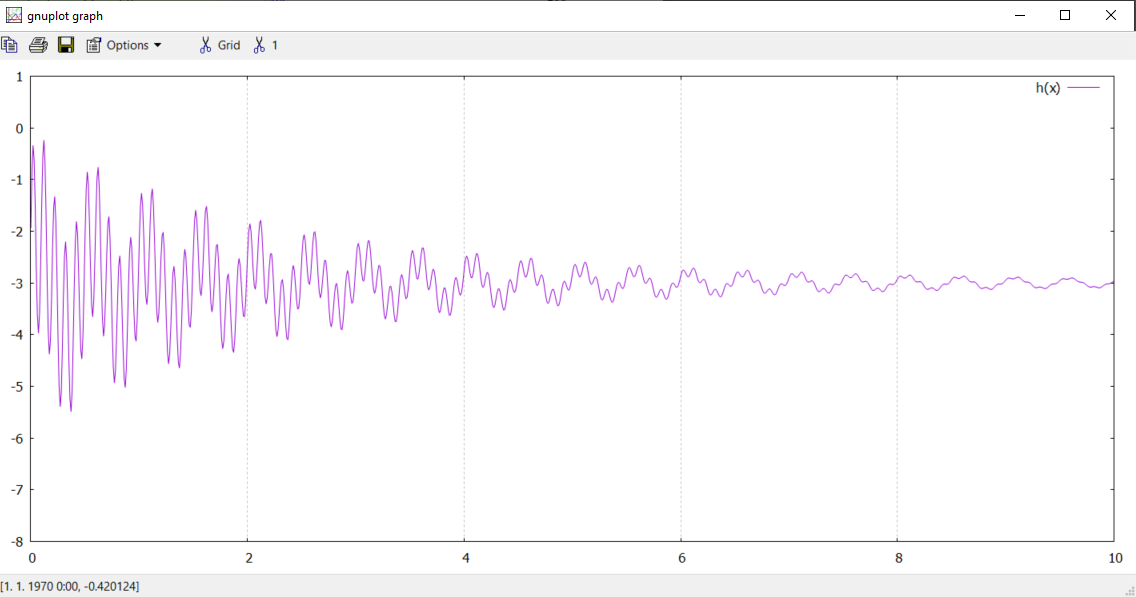
A multifrequency, decaying sinosoidal plot
set samples 1000
h(x) = exp(-x/t1)*A1*sin(2*pi*f1*x+phi1) + exp(-x/t2)*A2*sin(2*pi*f2*x+phi2) – d
A1 = 1
A2 = 2
phi1 = 0.5
phi2 = 0.3
t1 = 4
t2 = 2
f1 = 2
f2 = 10
d = 3
set xrange [0 : 10]
set yrange [-8:1]
plot h(x) with line