Here are some techniques, commonly used to improve signal to noise ratio (SNR, S/N ratio) in data.
Method 1: Averaging more data
Time domain Data
This is raw data from 10,000 acquisitions (red) averaged together: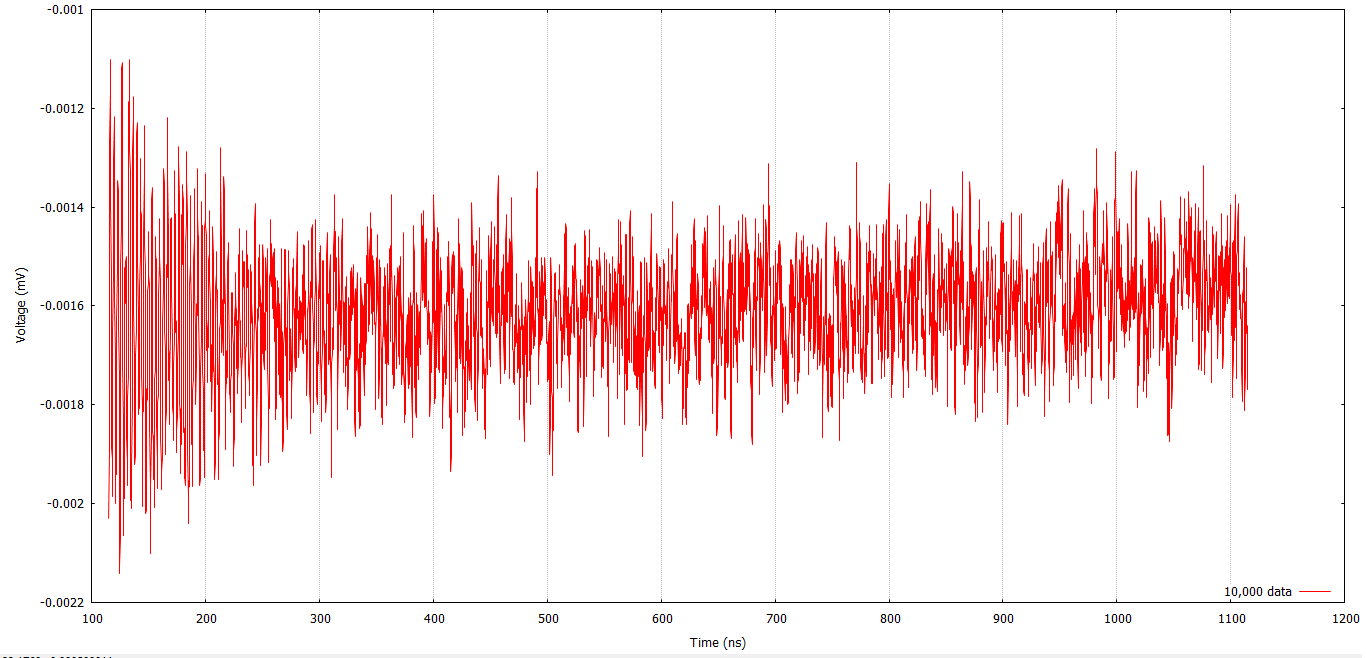
And this is data from 40,000 acquisitions (blue) averaged together:
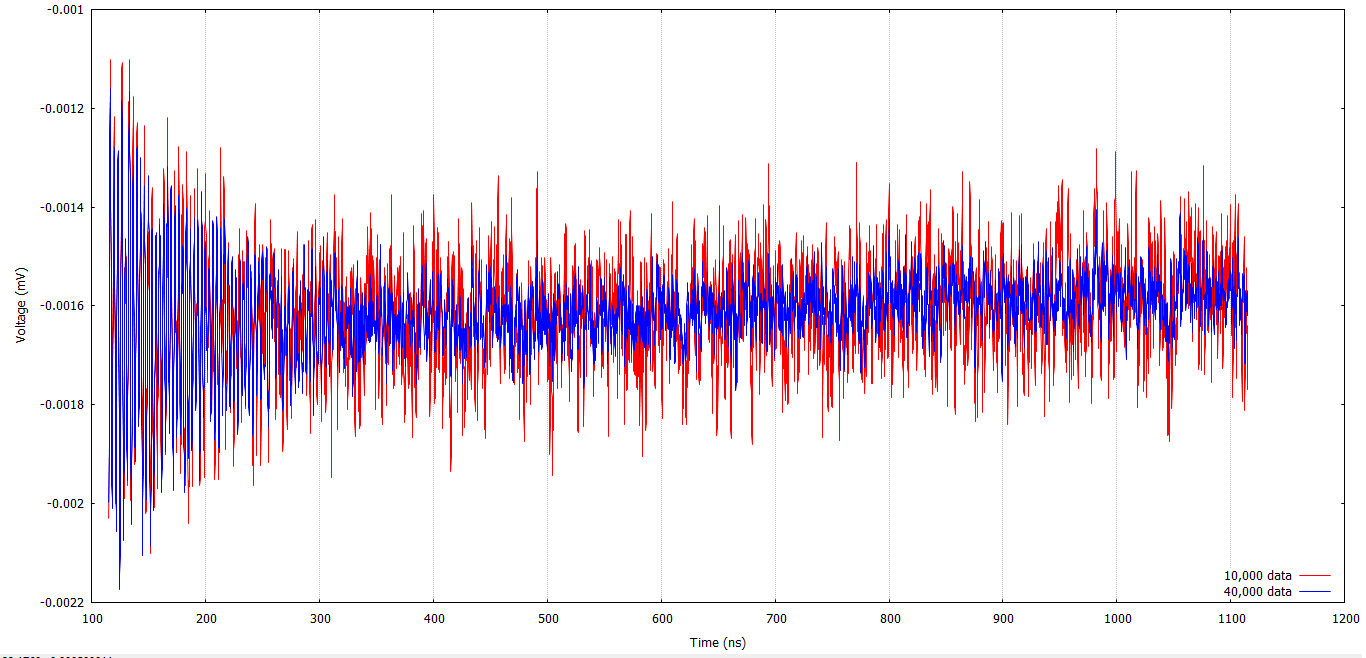
As you can see, by collecting more data and averaging them, the SNR can improve by (theoretically) sqrt(N_new/N_old).
In this case, the N_new/N_old = 4, therefore the new SNR should be around twice higher than 10,000 averaged data.
Although the noise amplitude is easily measured, it is hard to determine the signal amplitude in time-domain. Hence, SNR cannot be conclusively determined from the time domain signal.
Frequency domain Data:
By performing Fourier Transform, we can obtain the frequency domain data. Below are frequency domain data from 10,000 (red) and 40,000 (blue):
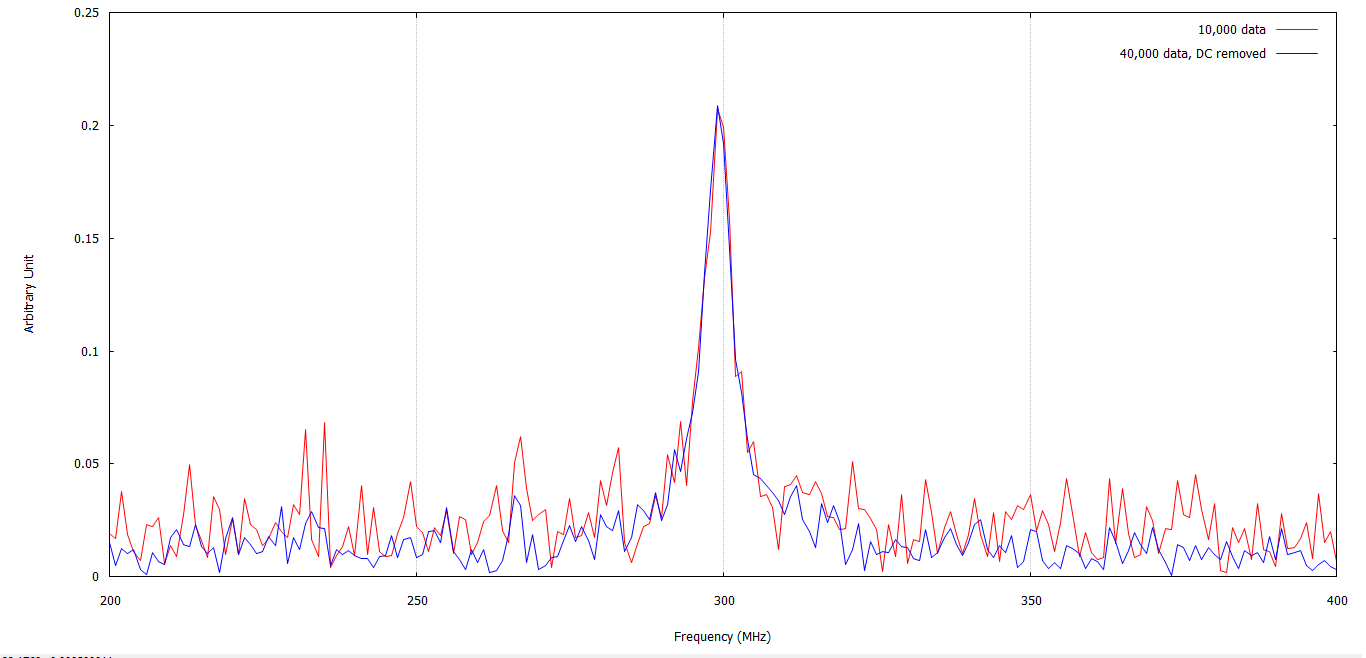
Since the signal (293 MHz – 312 MHz) is easily discerned from the noise, we can determine the SNR:
| Parameter | Value from 10,000 data | Value from 40,000 data |
| Signal peak | 0.207565 | 0.209022 |
| Noise Average (200 – 275 MHz) |
0.0229056 | 0.0131474 |
| SNR | 9.06176 | 15.8983 |
Method 2: Removing noise and DC offset
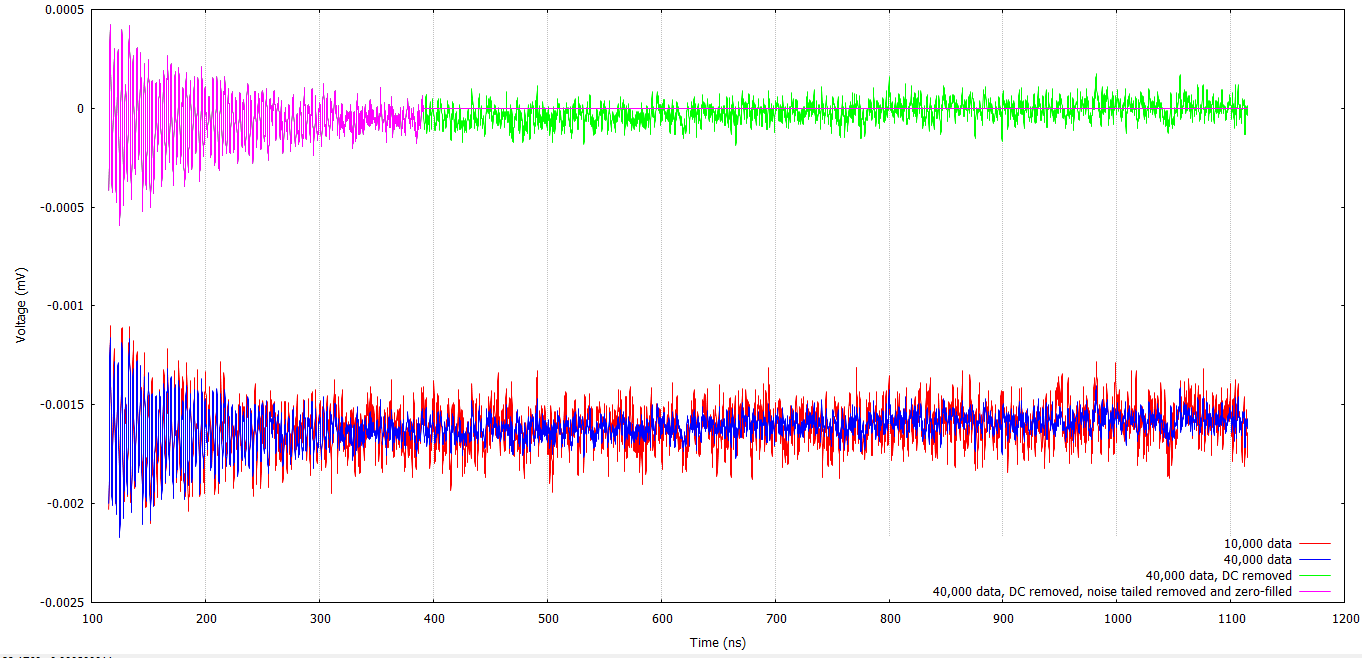
By removing the noise tail and replacing it with zeros, the noise amplitude in frequency domain can be further removed. However, in order to do this, any DC component from the signal must be removed.
The processed data in time domain:
The results in frequency domain:
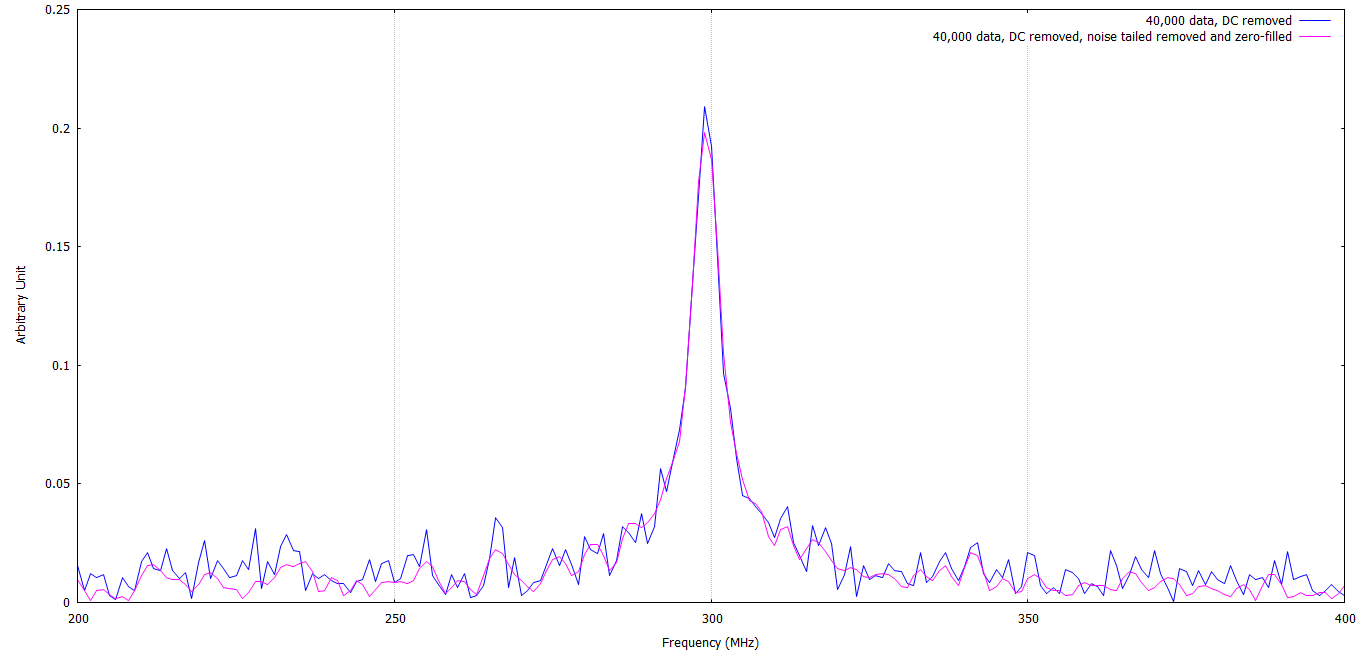
As a result of replacing the noise at the tail of the signal with zero, the SNR has further improved to:
| Parameter | Value from 10,000 data | Value from 40,000 data | Values from 40,000 data, DC removed and noise at tail replaced with zero |
| Signal peak | 0.207565 | 0.209022 | 0.198212 |
| Noise Average (200 – 275 MHz) |
0.0229056 | 0.0131474 | 0.00918406 |
| SNR | 9.06176 | 15.8983 | 21.5822 |
