Here are my take for writing a decent lab report. Included are common mistakes in the lab report.
Remember, you are writing a scientific report.
It should contain as much technical information as possible.
Readers should be able to fully understand and replicate your experiment using only your report!
If you plagiarize from a source, I will find out and you will get 0 marks.
(See examples)
Title
- For our 3rd year lab session, you are free (and recommended) to rewrite a more descriptive title than the provided title. For example: “Hall effect sensor” does not tell anything about the experiment. A better title would be “Magnetic field strength of a button magnet with distance”.
Objectives
- Write proper objectives. Try to include at least one or two measurable objectives.
Introduction/Theory/Literature Review
- Define all variables in your formula the first time it appears. Also define any acronym that you used.
- Provide sufficient theories and formula for your report.
- References should be cited here. Not just mentioned by name in the References section.
- Provide information on the operational mechanism of the sensor.
e.g.: You are using Hall effect sensor but what is hall effect? How can Hall effect be used to measure magnetic field? - Do not write in point forms/bullets/numbered. Write them as paragraphs.
Methodology & Data Acquisition
- Always include diagrams/photos/pictures/schematics, caption and label them using arrows and text.
Here is an example of an image without any labels. As a reader that is not familiar with this experiment, can you tell what are the components used in this image and how are they connected? 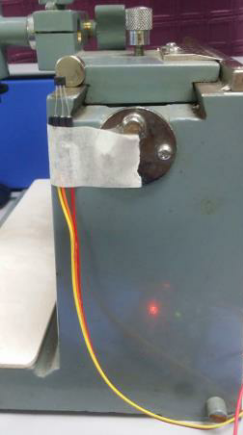 If you wrote a computer program, you must include a programming flowchart.
- Describe the process of data acquisition from the sensor until it becomes a data file.
- Pin and wiring connections for your circuit.
- Include how the data acquisition board records the data (e.g.: using analog input/digital/PWM etc.)
- Include information for extra electronics that you built (how it works, what is the purpose, etc.)
- Provide detailed information on the sensor:
- Model, manufacturer, pin configuration and wiring connection. Go find the datasheet!!
- How to use it to measure the physical parameter i.e. some sensors can only operation at certain conditions/configuration/arrangement etc.)
- Did you use any signal conditioning? If yes, describe in detail (provide pin diagrams, etc..)
- Did you calibrate your readings? If yes, describe in detail. e.g. How did you convert the voltage from your sensor to temperature (°C)?
- What is the limit of your calibration? Is it applicable for all values from your sensor? Are you sure?
- Justify why you used the sensor/method/apparatus in your experiment.
Data Analysis
- All numbers must be accompanied by proper physical units.
- Uncertainties from experiments must be realistic and practical. A common mistake is to take the resolution of the equipment as the uncertainty. The preferred method to determine the uncertainties are:
1. The best estimate for uncertainty is the standard deviation of a repeated measurement.
2. If this is not possible, then the uncertainty should be realistically determined from the experiment (example when looking at the ruler and the scales are unclear, then one can expect a higher uncertainty).
3. The next option is to use the uncertainty stated on the equipment itself or in the manufacturer’s datasheet (example the resistor would commonly state the uncertainty in terms of %).
4. The last option is to use the smallest significant << not preferred. - Find for known/theoretical values to compare them with your experimental results. If there are no theoretical values, calculate them using a suitable equation. Then compare the difference between theoretical value and your experimental value. (This is not error!) You might want to provide an in depth analysis here and a briefly restate this in your conclusion. If there is no known values, you can calculate them using any suitable equation. For example, if you are measuring the resistance of a tungsten wire and you are unable to find any known/published data to comparison, you can calculate the expected/theoretical resistance based on the material resistivity, length and area. You can now compare your calculated value with your measured value
- Remember that error propagates. (You have learnt it in your 1st year lab. For more info, read up “An Introduction to Error Analysis” by John R. Taylor or refer to this.)
- Do not forget your units!!
- Graphs:
- Always, always data fit your graph (preferably using Gnuplot).
- Plot both data points and data fit.
- Strongly recommended to write the equation of fitting equation into the graph itself.
- If your data has uncertainties, you should include them during the fitting process to obtain better results.
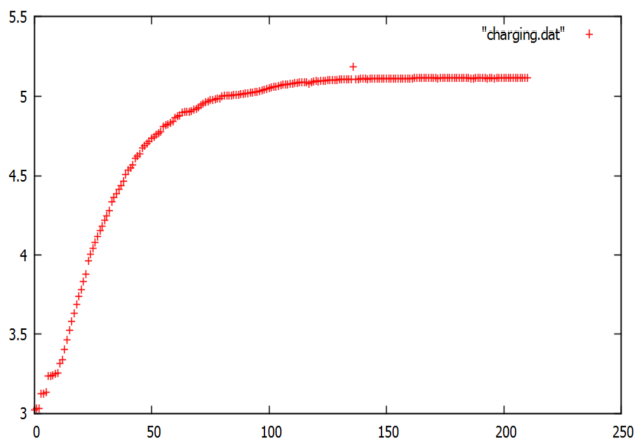
This graph above is a bad graph. Lack of titles, labels and data fitting.
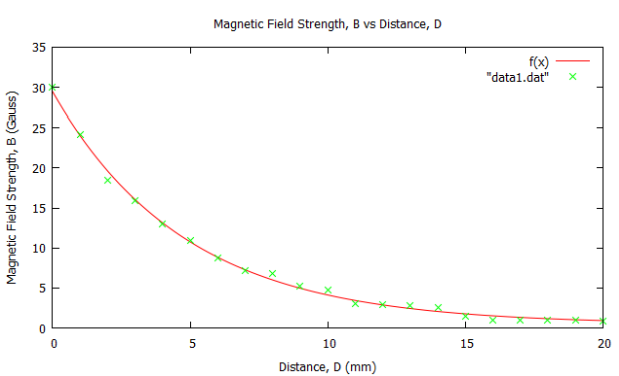
The graph above is a much better graph. Should have written the equation of the data fit.
Discussion
- Do not write in point forms/bullets/numbered. Write them as paragraphs.
- Compare the known/theoretical/calculated values with experimental values and discuss the cause of the difference (the cause is not necessarily from errors or mistakes in your experiment.. then? where did they come from? interesting… right?).
- Discuss factors that cause measurement errors.
- Suggest improvements that can minimize errors.
Conclusion
- Do not write in point forms/bullets/numbered. Write them as paragraphs.
- Refer back to objectives, restate the measured values and state whether the objective was met.