
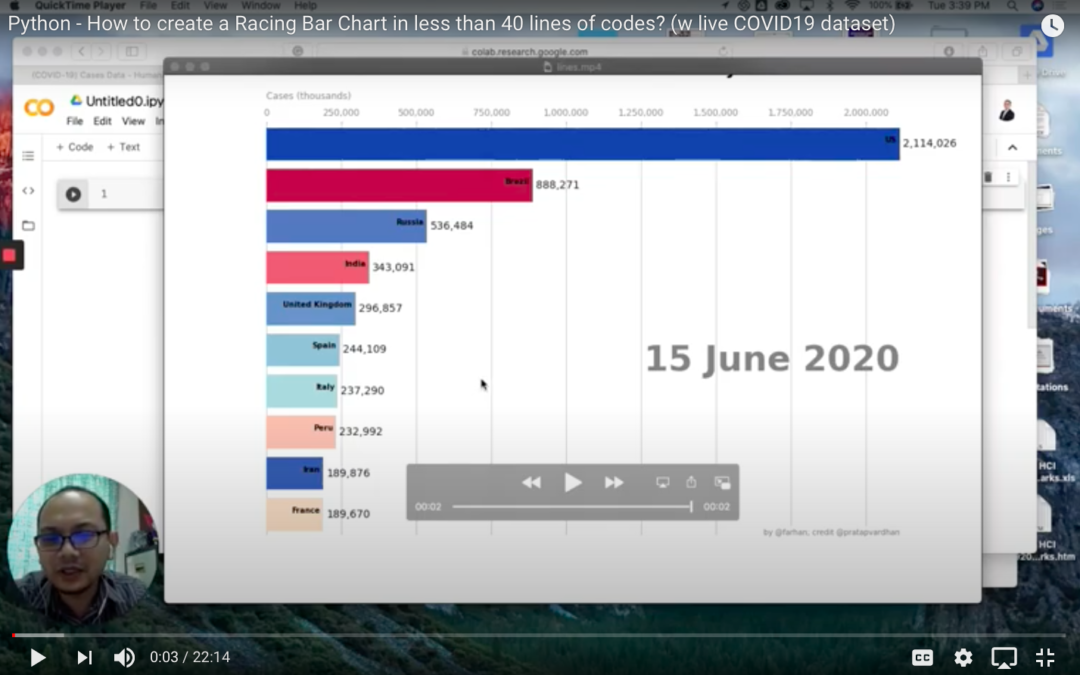
Racing bar chart with online daily updated data
I created the following racing bar chart tutorial months ago in showing how anyone can create, animate and gain insight from a live data and an animated chart. If you run the codes, it is horrified to see that the coronavirus threat is worryingly becoming worse in...
My four ingredients in teaching and learning programming throughout the MCO “lockdown”
The introduction of the MCO has led to the stop of all face to face lectures. Although online learning has been around for sometimes, It has never been in such limelight and needs as of today. Teachers and lecturers are no more assisted by the well-equipped labs,...
Opinion – Surviving COVID19 social distancing digitally
On the 11th of March 2020, WHO declared COVID19 as a pandemic. The spread of the virus through human-to-human contacts has made social interactions and our everyday activities from meetings, travelling, to even shopping constrained. As advised by the WHO and the...
Completing the missing 3D puzzle pieces: Using Modified Butterfly Interpolation Scheme for Hole-filling in 3D Data Reconstruction
This paper presents an alternative technique of hole-filling method in pixel nearest neighbour for 3D volume reconstruction, in order to reconstruct the voxels that are not captured by the medical imaging scanner such as ultrasound. However, many existing works claim...Dr. Farhan Mohamed

“Information can be visualised in many ways, which lead to many exciting new insights”
Facebook | Google Scholar | CV