Editing data in scientific calculator

still using the same data as in the previous post:

60, 70, 85, 52, 93, 58 , 71 (n=7)

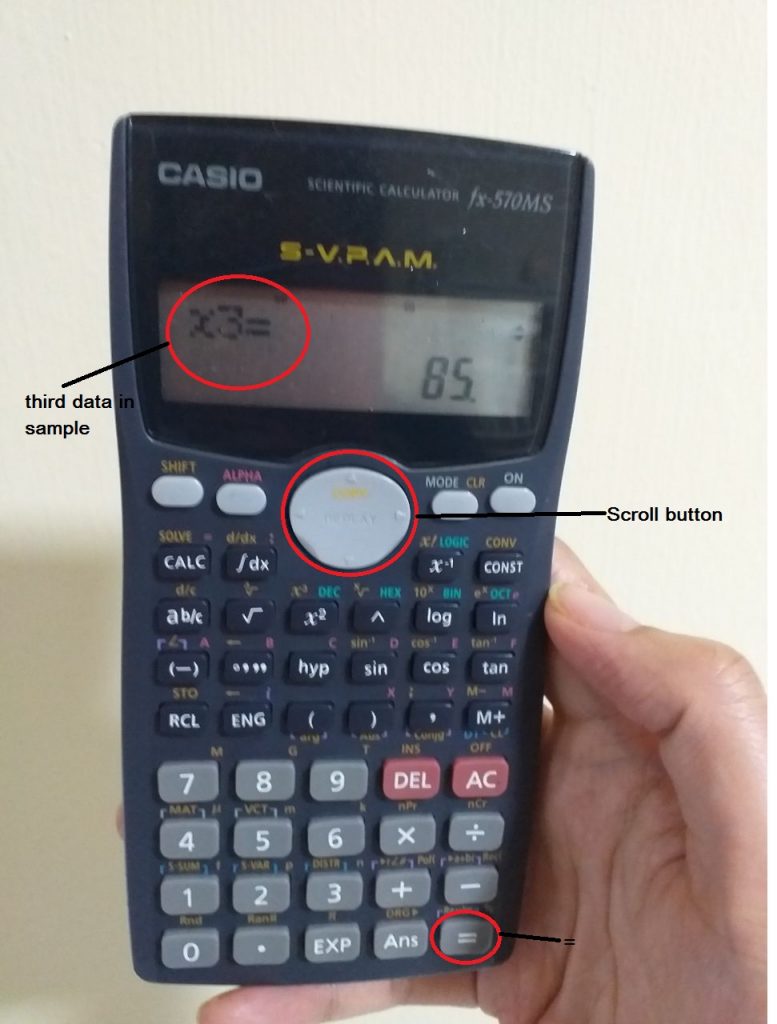
You can check whether you have keyed in the correct data set by using the scroll button on the beneath the screen, in the middle of your calculator.

So, if you want to check your data again just press the on button  (this will remove any calculation that you are doing at the moment), then go to the scroll button, and press scroll down.


You will see on your screen

x1= 60  scroll down freq1 = 1  (this means that the first data keyed in is 60, and it is set as the first frequency)

if you hit scroll down again, you will see

x2=70, scroll down freq2=1

Say you made a mistake when keying in the third data, x3 it is supposed to be 85 but say you keyed in 82.

in order to correct this mistake, all you need to do is to make sure the screen shows

X3=  (82-which is the wrong number)

then you just key in the correct number, 85 and press =

then you will see, in the x3= screen is replaced with 85.  This means the data has been corrected.

After that, you may continue to conduct your calculation as you wish.
 

using scientific calculator to calculate mean, and standard deviation

If you have the scientific calculator fx-570MS, you can use it to easily  calculate mean and standard deviation of a given set of data.

Let’s say you have a sample with the given set of data such as:

60, 70, 85, 52, 93, 58 , 71 (n=7)

and you want find the mean and standard deviation.

The first thing you need to do is to

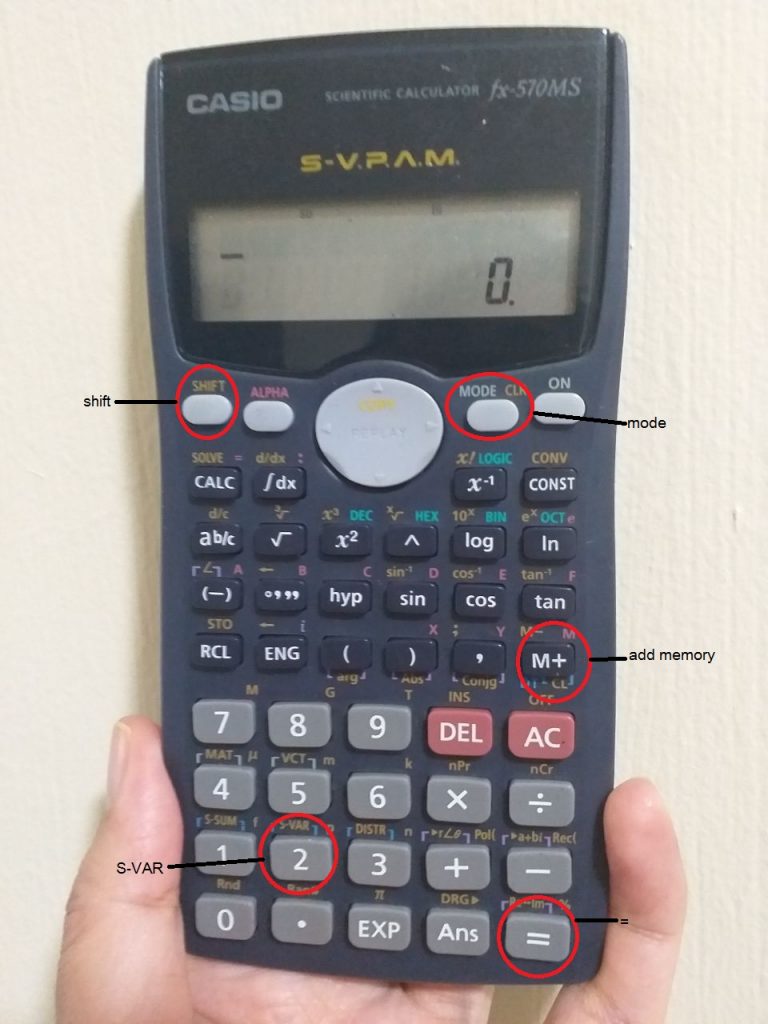
clear all data: shift, mode, 3 (All) =

and set mode to statistics: mode, mode, 1 (SD)

then you can begin to key in the data:

just type the number and press m+ which mean add memory

60 m+, after you press m+, then n=1 will appear on the screen. this means that the sample number you have added into your calculator is 1, and 60 is your first sample.

continue adding all the data in your calculator:

70  m+

85  m+

52 m+

93 m+

58 m+

71 m+

at the end , your n should be n=7

Then, to find your mean just press

shift 2 (s-var), 1 (x bar), =

and the mean is 69.86

to find the standard deviation, just press

shift, 2 (s-var), 2 (xsigman), = 13.746 if your data is considered to be population

shift, 2 (s-var), 3 (x sigma n-1), =14.84  if you data is a sample.

Therefore, you need to be aware about the data set that you have, whether it is a sample or population. (In this case, you need to find the standard deviation for a sample, so you should select 3 (x sigma n-1) ).

so, here it is, simple right!


online class mppm1103

online class mppu 1034

Math Activity at SMK Mutiara Rini

In this activity the students had to move the balls from one bucket to another and to solve a mathematics problem by drawing together. Our focus this time was on teamwork which is essential for the success in STEAM activities. we actually brainstormed about conducting some mathematics art activity but our budget was only RM200 to buy stuff so it’s definitely not enough for 1200 students! I definitely want to explore more hands on STEAM activities such as this as the students seemed to have lots of fun.