
This course is designed to provide students with the foundations necessary for understanding and extending the current state of the art in data visualization and interactive design.
At the end of this course, students are able to understand the connection
the key techniques and theory used in visualization, including data models, graphical perception and techniques for visual encoding and interaction, build and evaluate visualization systems, and create a project to engage in independent and lifelong learning to read and discuss research papers from the visualization literature.
This subject will introduce the latest tools best for visualization. As for today, based on gartner magic quadrat – this class is using tableau & alteryx combination in demonstrating the visualization.
1. Software of Tableau
Get the free student’s license at https://www.tableau.com/academic/students
Get the free instructor’s license at https://www.tableau.com/academic/teaching
2. Software of Alteryx
Get the free student’s license at https://www.alteryx.com/why-alteryx/alteryx-for-good
8 January 2025
Last physical Data Visualization class this semester (Semester 1 2024/2025)
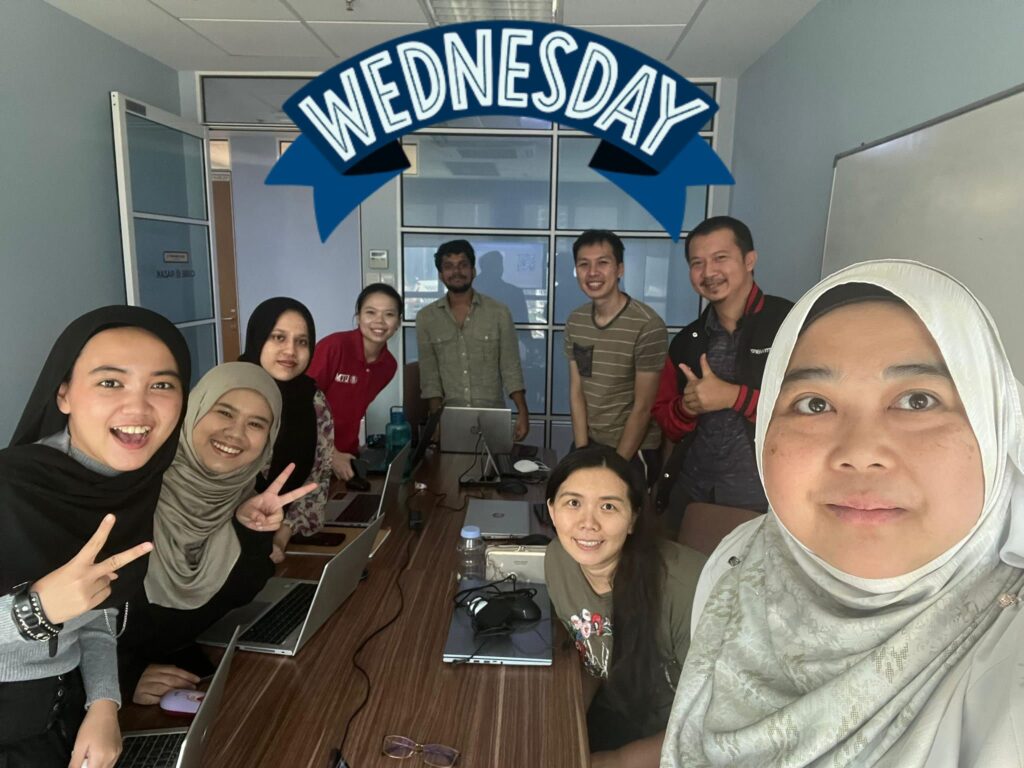
From left – ehem ehem me, Heshin from China, Faizal Hlp gomen, Chen from KL, Nishin from Doha, Su orang KL, Nishin from Bangladesh, Bella and Aisyah nice girls from Malaysia.
This semester, we add new flavours to Visual Analytics. Instead of focusing on the dashboard, everyone needs to roll up their sleeves to prep and integrate the dataset. Then refine the data quality using prep build. These skills are significant in their data analytics career.
I also tried so much to make them understand how to read the data from the attributes and values. How to differentiate between dimension vs measures and interchangeable within it. How they should grab the big picture from the dataset. So then they can perfectly design the dashboard. Harap paham la ye uols.
All the best to all – remember to always wear both your human hat and machine hat when playing with the data.