Tag Archives: Higher Education

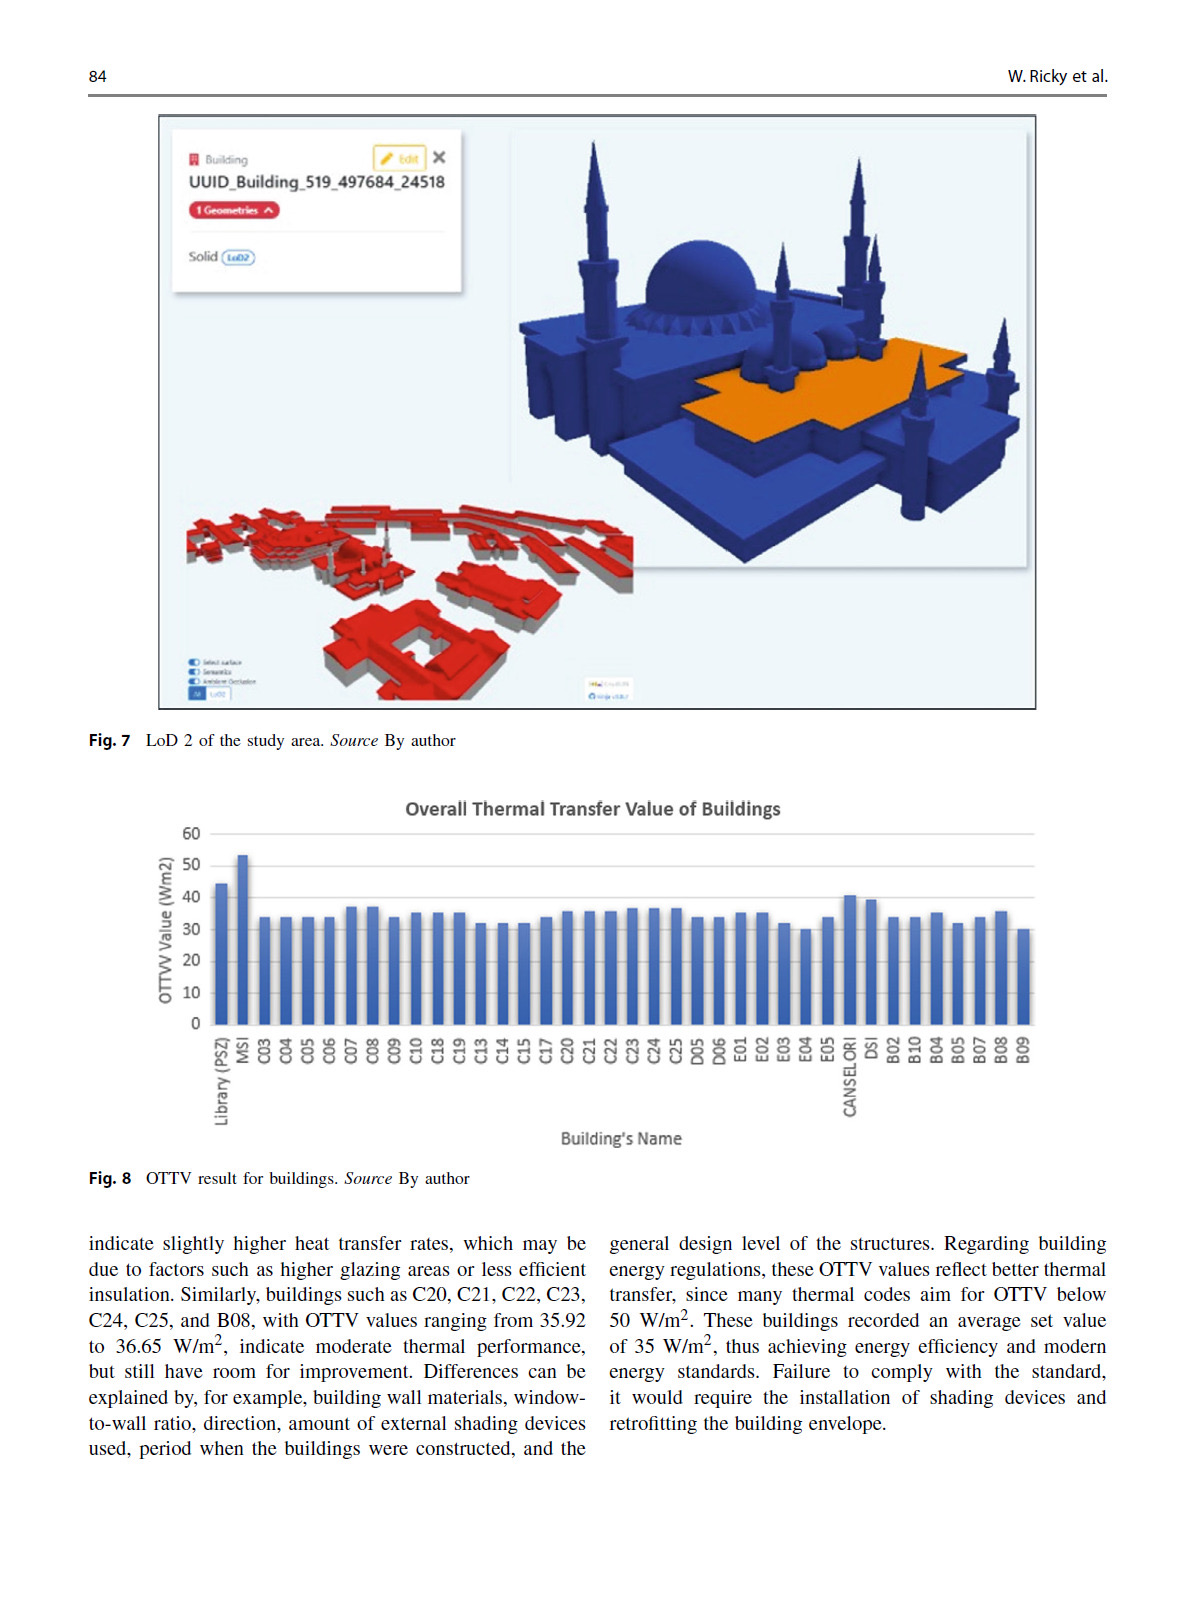
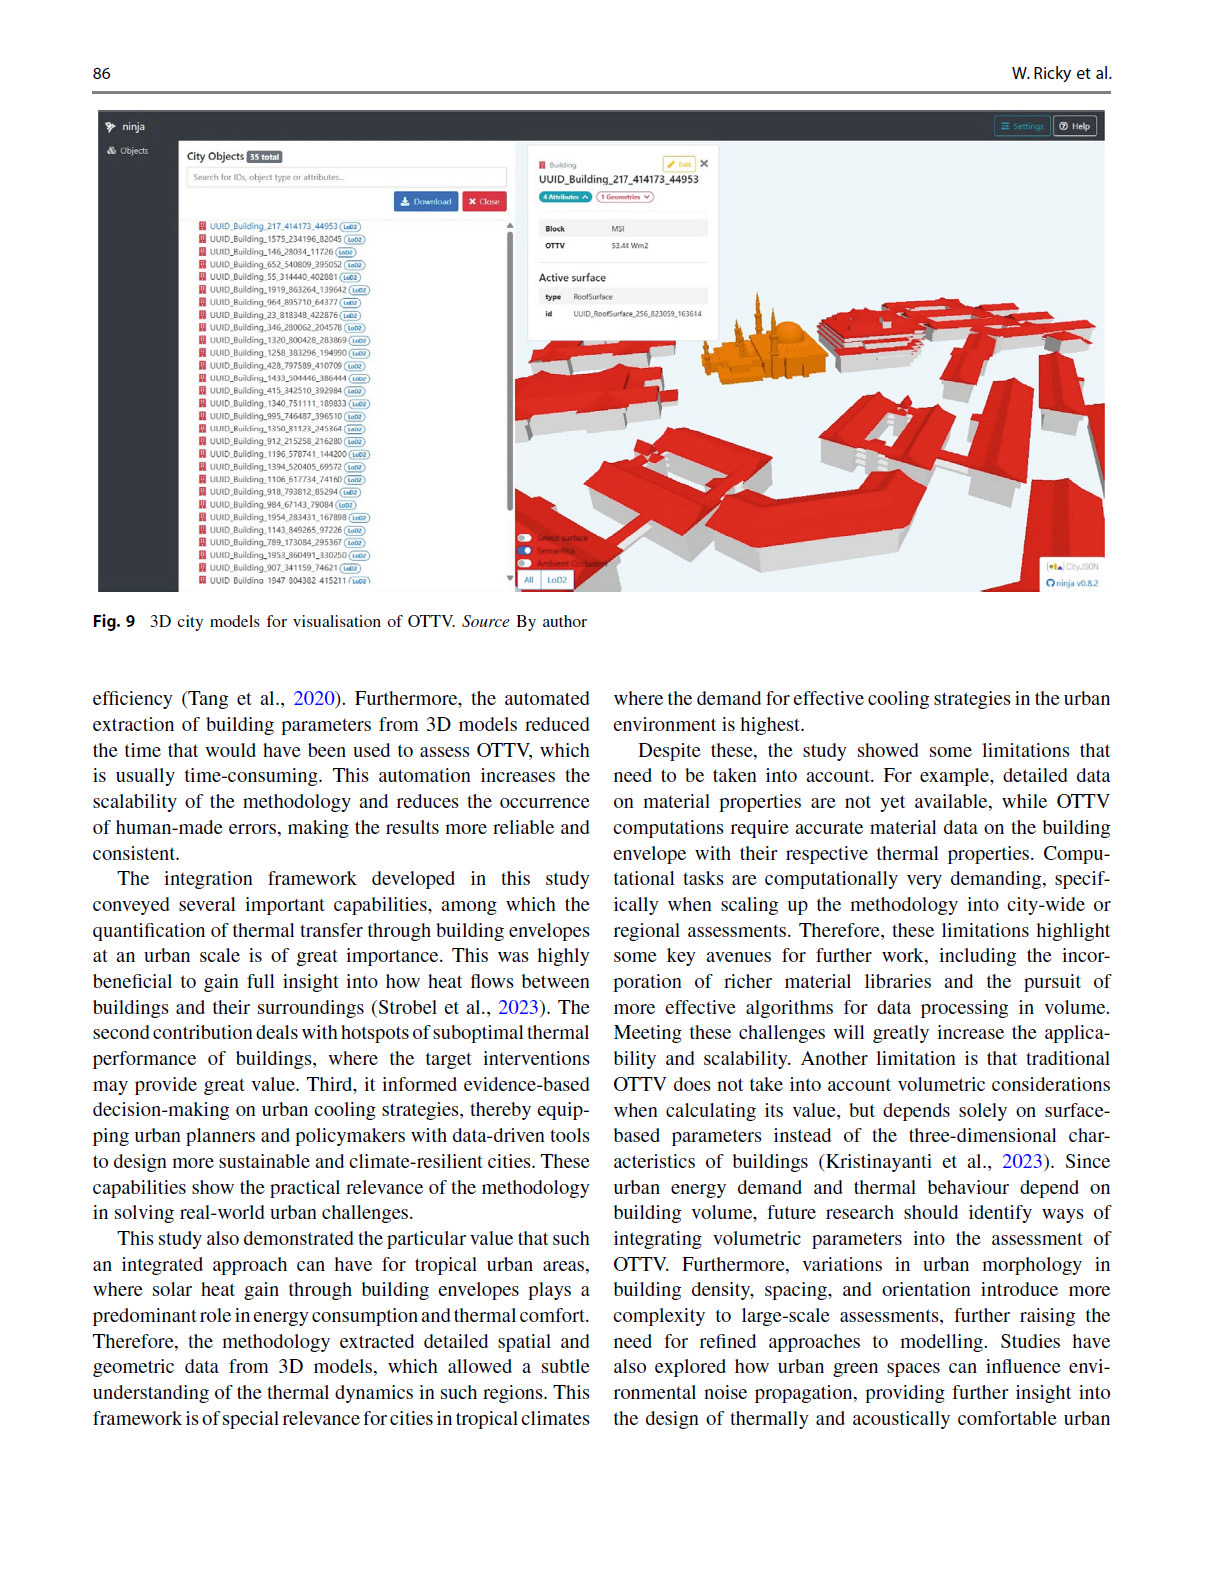
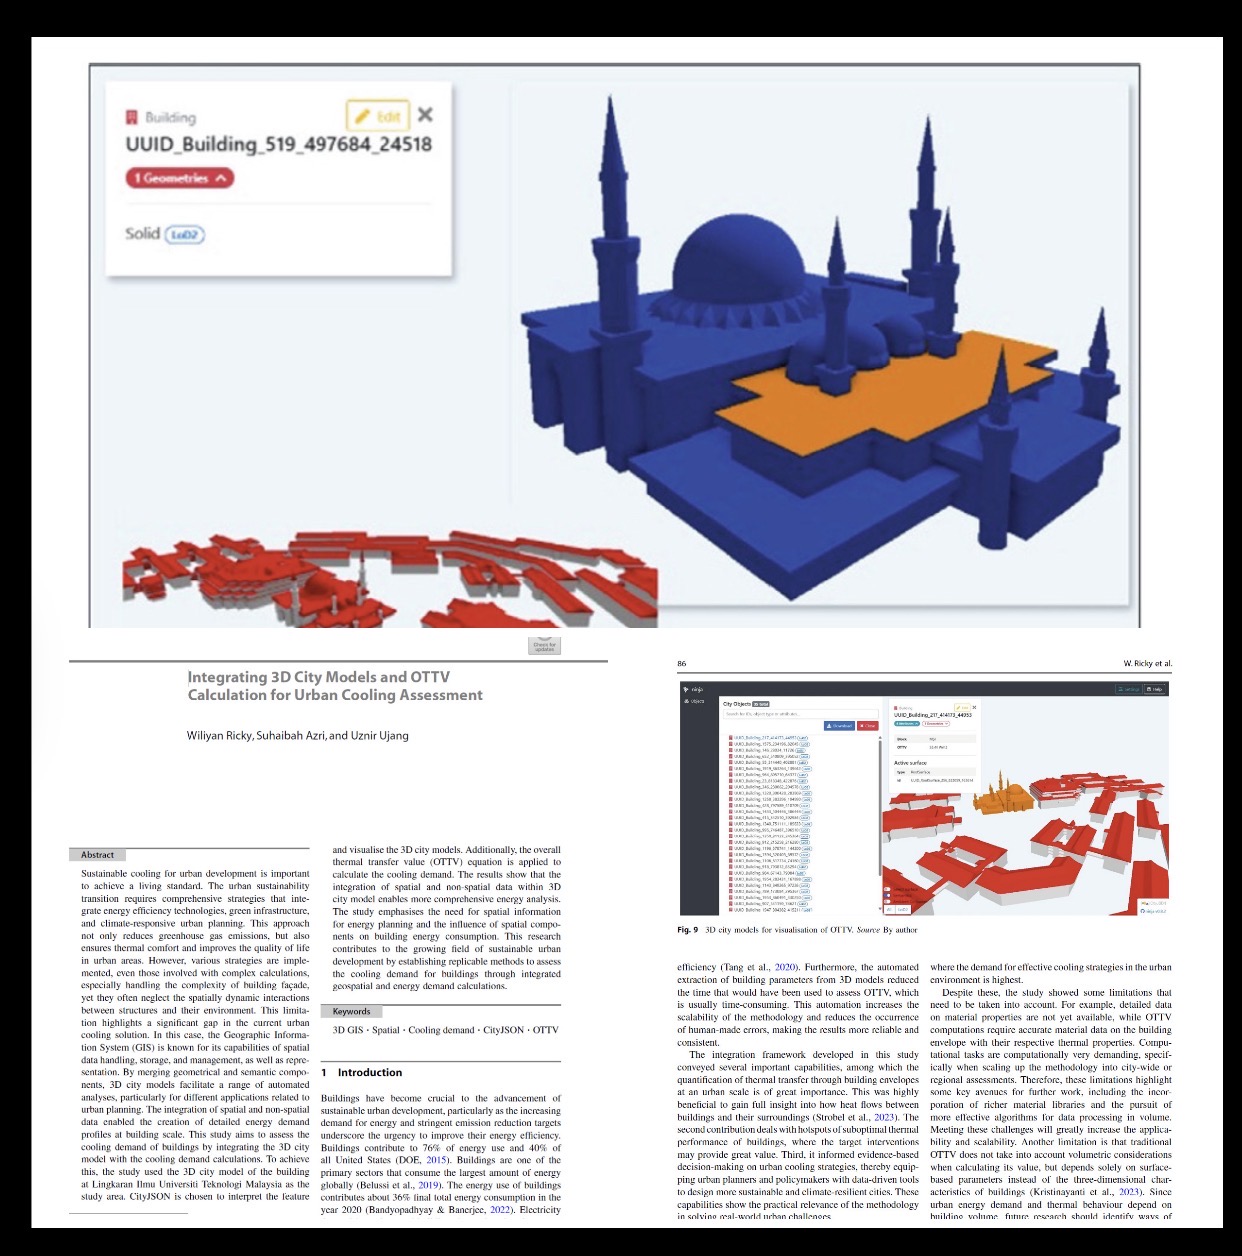
OVERALL THERMAL TRANSFER VALUE (OTTV)

Screenshot

OVERALL THERMAL TRANSFER VALUE (OTTV)

Another piece of work from our lab has officially been published. 😊

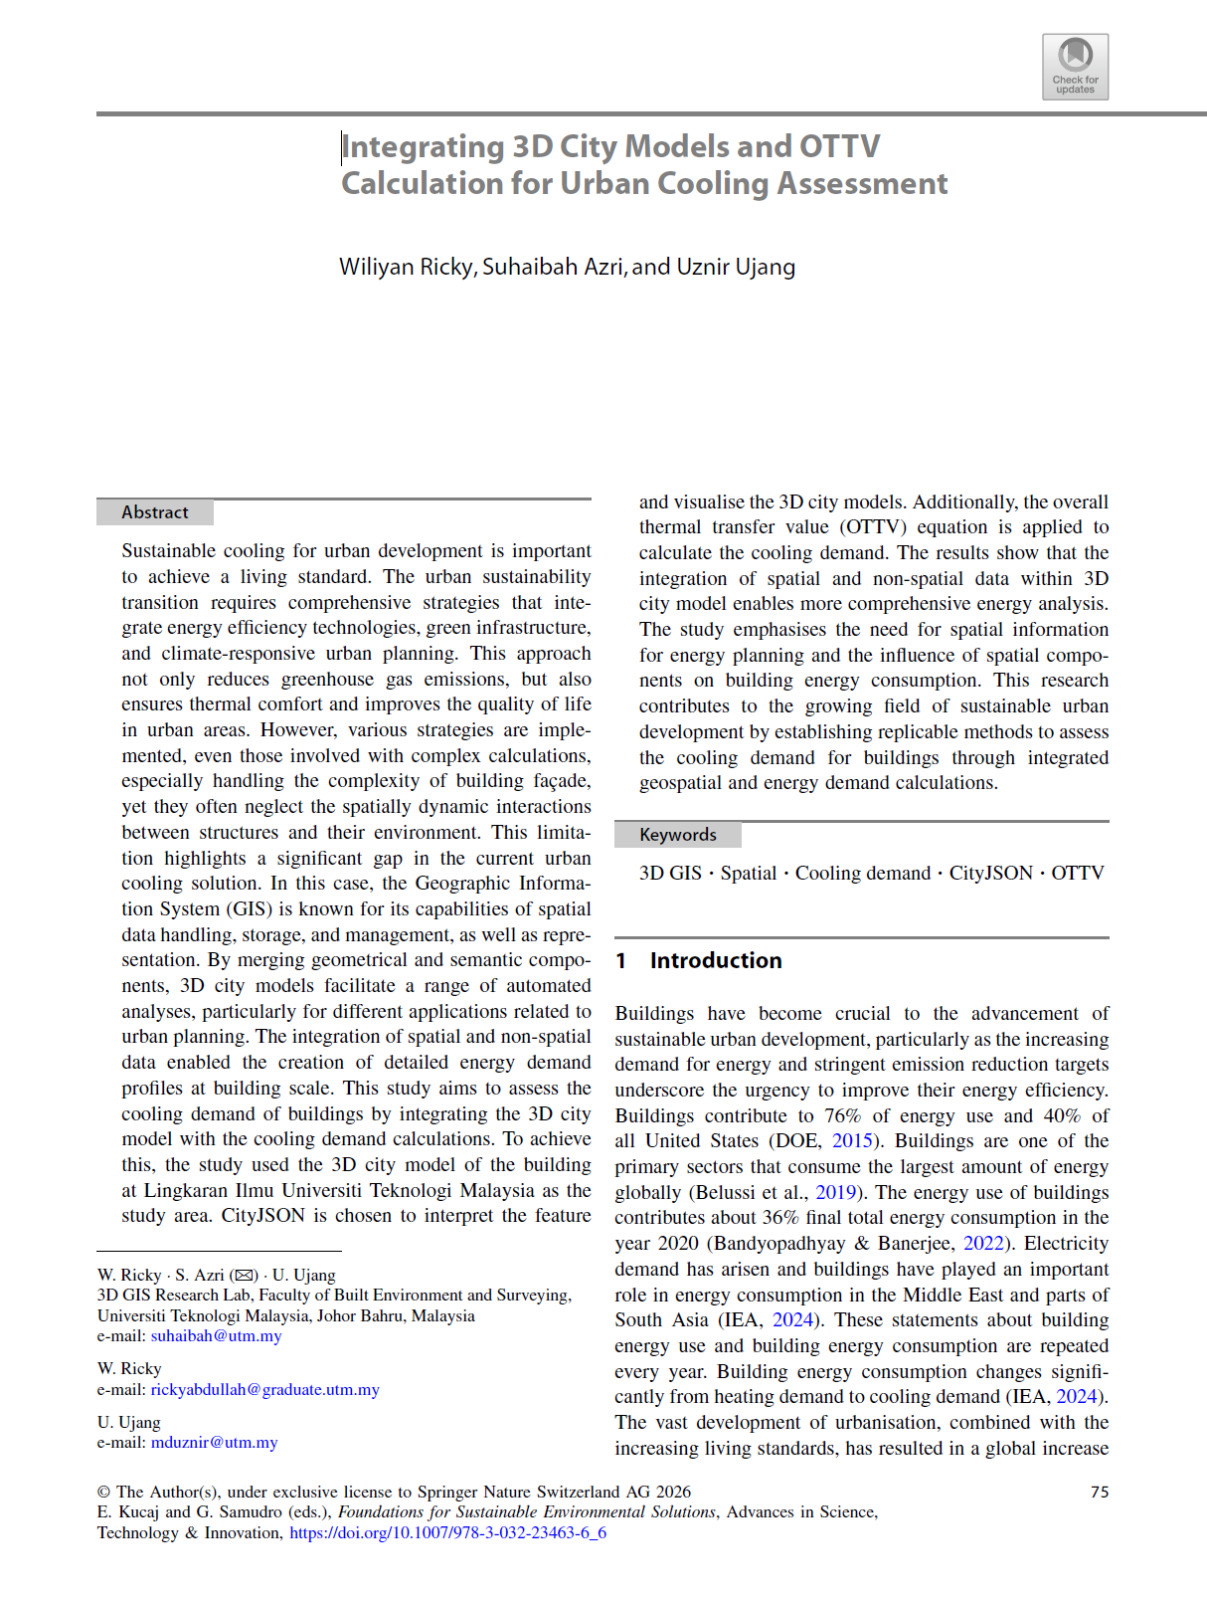
Congratulations to Wiliyan Ricky on the publication of our paper:

“Integrating 3D City Models and OTTV Calculation for Urban Cooling Assessment.”

This paper was presented at an international conference in the Philippines and is now officially published in the conference proceedings, which are indexed by Scopus.

The study integrates 3D City Models with Overall Thermal Transfer Value (OTTV)calculations to evaluate the cooling performance of buildings in urban environments. By combining geospatial information with building energy analysis, the framework enables planners to identify buildings with higher cooling demand and supports evidence-based decisions for creating more energy-efficient and climate-responsive cities.

One of the key contributions of this work is demonstrating how 3D GIS and CityJSON can move beyond visualization to become analytical platforms for urban sustainability and energy assessment. This approach has strong potential for supporting future smart city initiatives, particularly in tropical climates where cooling demand is a major concern.

Congratulations once again to Wiliyan for this achievement. It is always rewarding to see our students continue producing meaningful research and sharing it with the international research community.

Looking forward to the next publication and the next challenge.

Publication: https://doi.org/10.1007/978-3-032-23463-6_6

#Scopus #3DGIS #3DCityModels #UrbanCooling #CityJSON
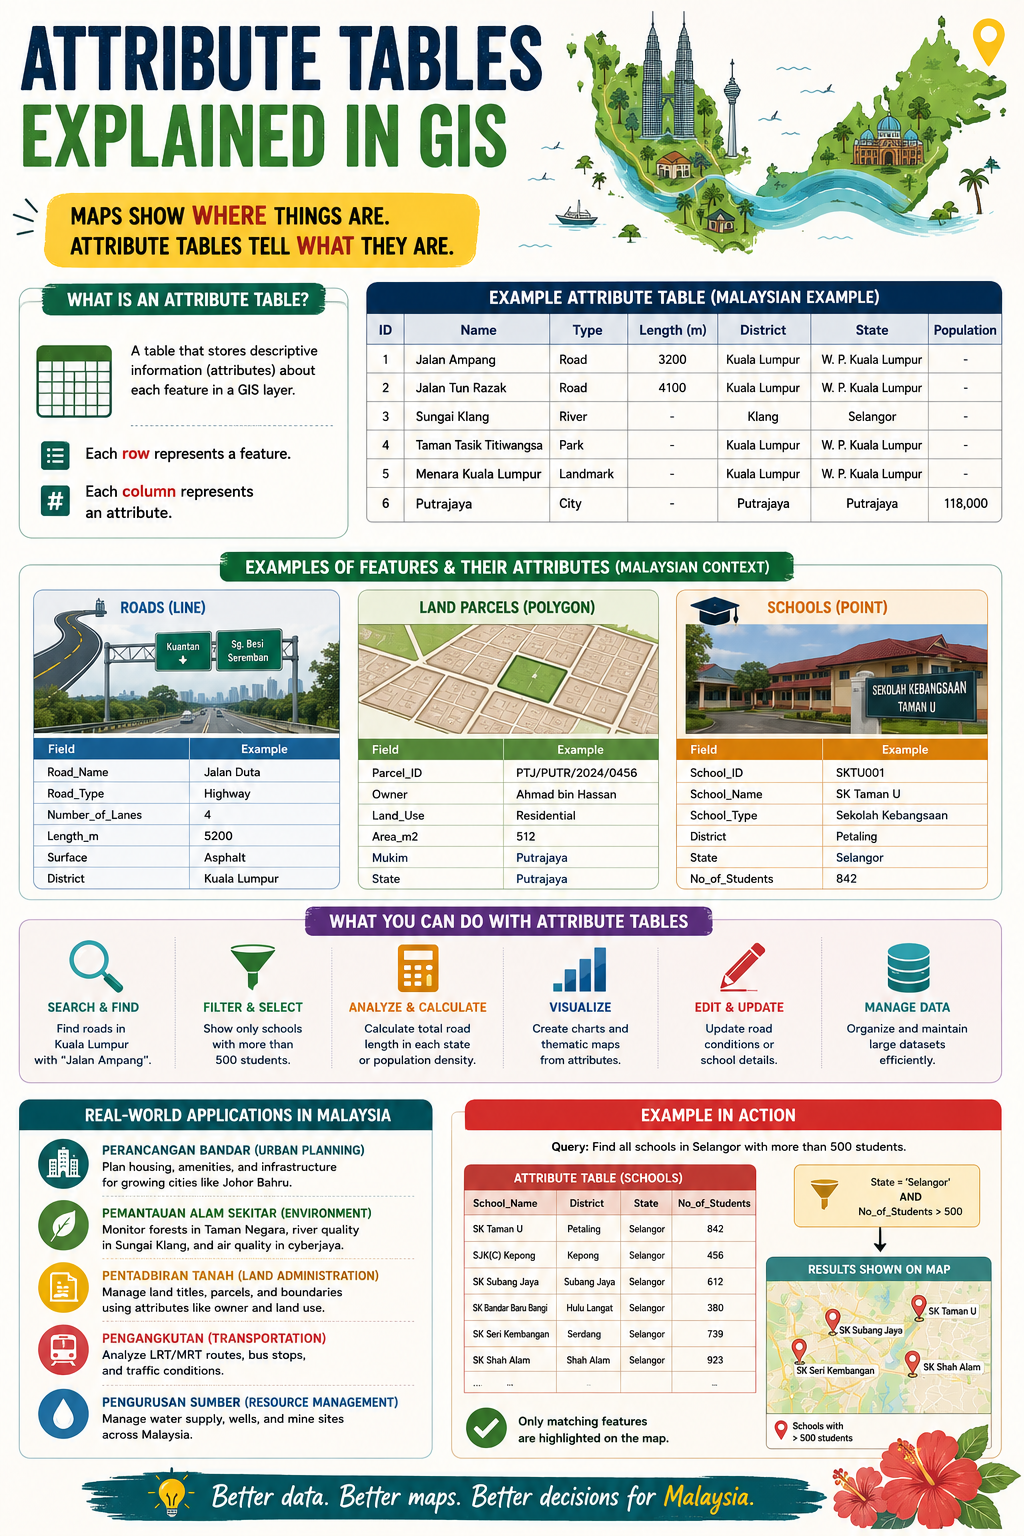
WHAT IF I TOLD YOU THE MOST IMPORTANT PART OF A MAP ISN’T THE MAP ONLY?

WHAT IF I TOLD YOU THE MOST IMPORTANT PART OF A MAP ISN’T THE MAP ONLY?

When people think about GIS, they usually focus on the map.

The roads, buildings, rivers, land parcels, and points of interest get all the attention.

But the real power of GIS often lies somewhere else: the attribute table. 📊

Maps show you where things are.

Attribute tables tell you what they are.

Every feature in a GIS layer has a corresponding record in an attribute table. Each row represents a feature, while each column stores information about that feature.

For example:

🛣️ A road can store its name, type, number of lanes, and length.

🏫 A school can store its name, district, school type, and student population.

🏡 A land parcel can store ownership details, land use, and area.

Without attribute tables, a map is simply a collection of shapes.

With attribute tables, those shapes become meaningful information that can be searched, analysed, filtered, updated, and visualised.

This is what makes GIS such a powerful decision-support tool.

Want to find all schools with more than 500 students?

Want to calculate the total road length in a district?

Want to identify residential parcels in a specific area?

The answers are stored in the attribute table.

A simple way to remember it:

📍 Geometry tells you where.

📊 Attributes tell you what.

The next time you open a GIS layer, don’t just look at the map. Open the attribute table and discover the story behind the data.

After all, better data leads to better maps, and better maps lead to better decisions.

#GIS #Geospatial #SpatialData #GISLearning #Mapping

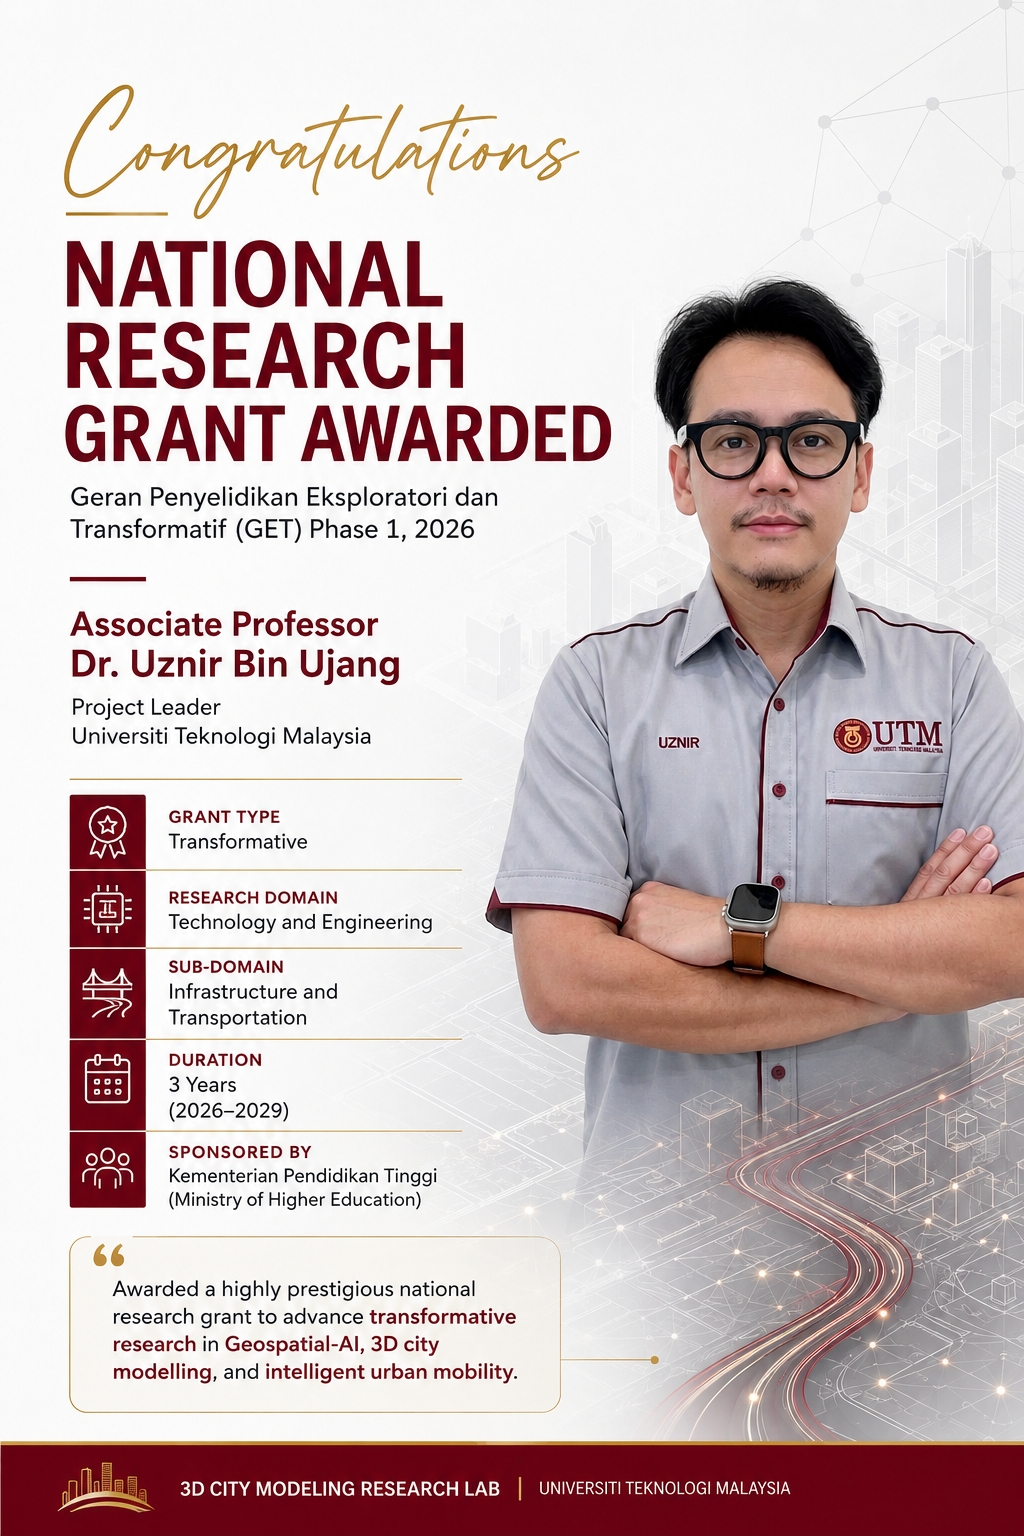
DID NOT EXPECT THIS ONE

DID NOT EXPECT THIS ONE

I applied for this grant thinking, “Let’s just give it a try.”

Honestly, I did not expect much. National research grants are highly competitive, and every year many outstanding researchers from universities across Malaysia submit their best proposals.

So when the result came out, it felt a little unreal.

Alhamdulillah, our project has been awarded the Geran Penyelidikan Eksploratori dan Transformatif (GET) Phase 1, 2026, funded by Jabatan Pendidikan Tinggi (JPT), Kementerian Pendidikan Tinggi (KPT).

After competing at the national level and being selected from thousands of applications submitted by researchers from universities across the country, I am truly grateful to the Ministry of Higher Education (KPT) for the trust and confidence placed in me 🤲🏻

The research will explore how Geospatial AI, 3D city modelling, and intelligent urban mobility can be integrated to better understand complex urban environments. Hopefully, the outcomes will contribute towards smarter and more sustainable cities.

Thank you to everyone who has been part of this journey, including my colleagues, students, collaborators, and mentors. Your support has meant a lot.

Now that the proposal has been approved, the real work begins. Looking forward to turning this idea into meaningful research and, hopefully, something that benefits the community.

#ResearchGrant #GeoAI #3DCityModelling #SmartCities #Research #UTM

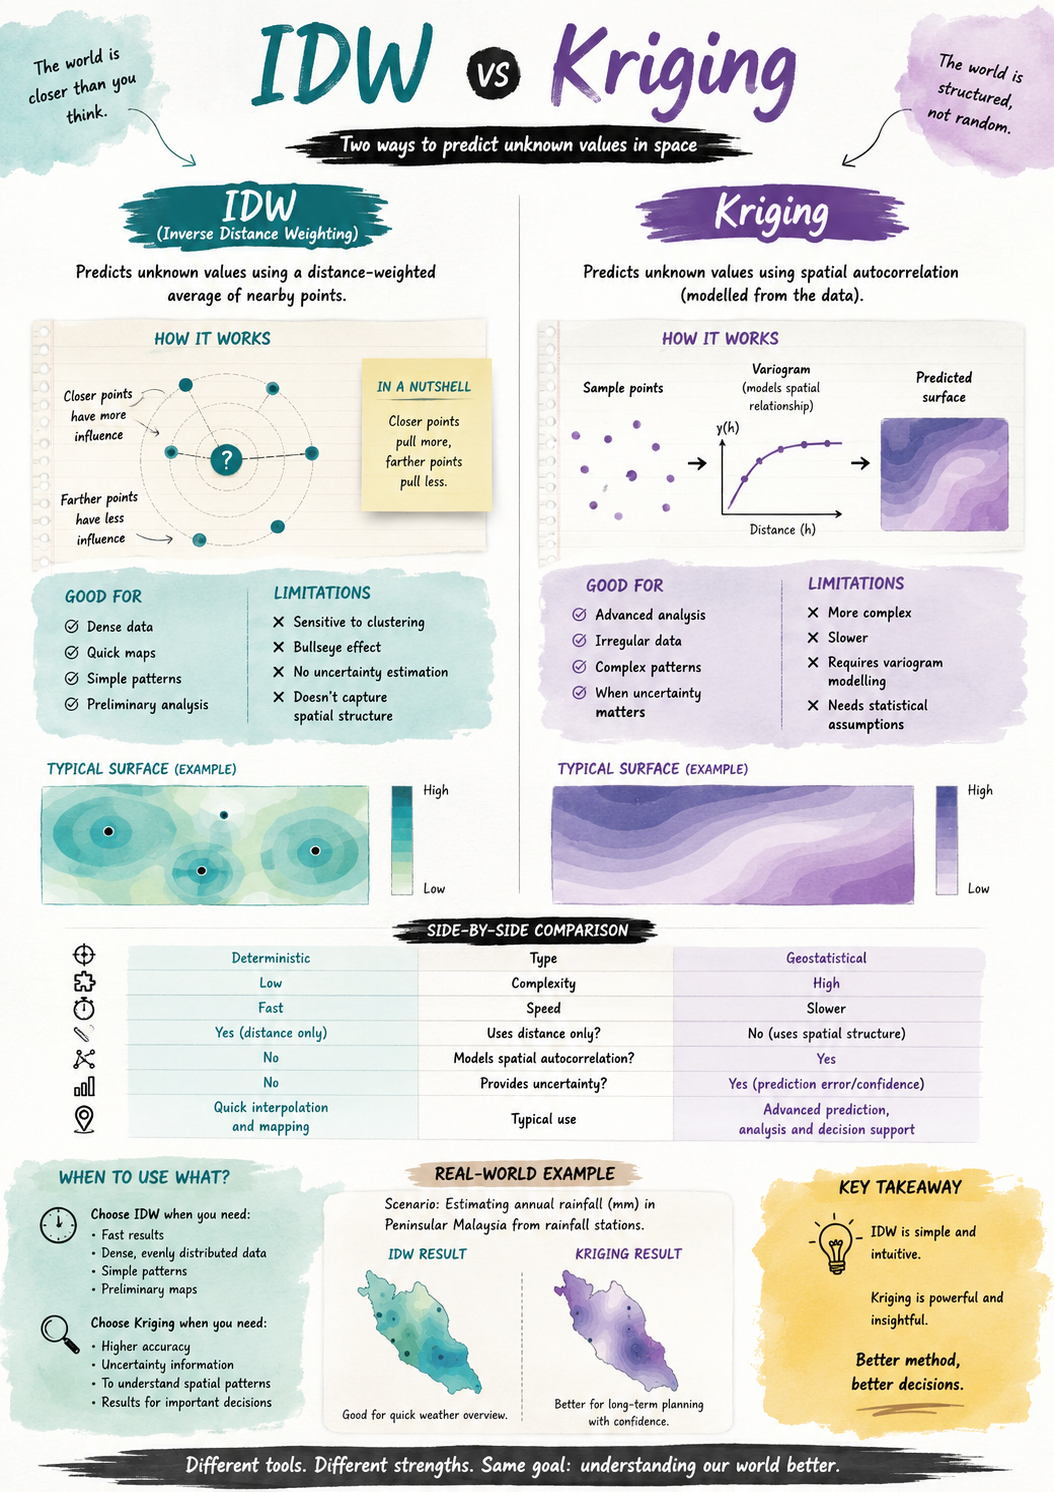
WHICH IS BETTER: IDW OR KRIGING?

WHICH IS BETTER: IDW OR KRIGING?

This is one of the most common questions in spatial analysis and geostatistics.

The answer?

Neither is always better. It depends on your data, your objectives, and the level of accuracy you need. 🤔

Both IDW (Inverse Distance Weighting) and Kriging are interpolation methods used to estimate values at locations where no measurements exist.

The difference lies in how they make those predictions.

📍 IDW assumes nearby points are more similar than distant points.

The closer a sample point is, the more influence it has on the prediction.

Simple. Fast. Easy to understand.

📍 Kriging goes a step further.

Instead of relying on distance alone, it analyses the spatial relationships within the data and models how values change across space.

Smarter. More powerful. More complex.

So when should you use each method?

✅ Choose IDW when:

  • You need quick results
  • Your data is dense and evenly distributed
  • You are creating preliminary maps
  • Simplicity is more important than statistical rigour

✅ Choose Kriging when:

  • Accuracy is critical
  • You need uncertainty estimates
  • Spatial patterns matter
  • Results will support important decisions

A simple way to remember it:

📌 IDW asks: “What are the nearest points telling me?”

📌 Kriging asks: “What pattern is the data revealing?”

Consider a rainfall mapping project.

IDW can quickly produce a rainfall surface from weather station data.

Kriging can do the same, but it also considers the underlying spatial structure of rainfall patterns and provides information about prediction confidence.

That extra insight is often valuable for planning, risk assessment, and environmental management.

The key takeaway?

IDW is simple and intuitive. Kriging is powerful and insightful.

The best interpolation method is not the most sophisticated one. It is the one that best fits your data and your decision-making needs.

Which interpolation method do you use most often in your GIS projects?

#GIS #SpatialAnalysis #Geostatistics #IDW #Kriging

BECAUSE RESEARCH IS HARD ENOUGH 

BECAUSE RESEARCH IS HARD ENOUGH ❤️

People often see the research papers, publications, and graduation photos.

What they don’t see are the countless hours spent in the lab… late nights, weekends, failed experiments, and the physical toll that comes with it.

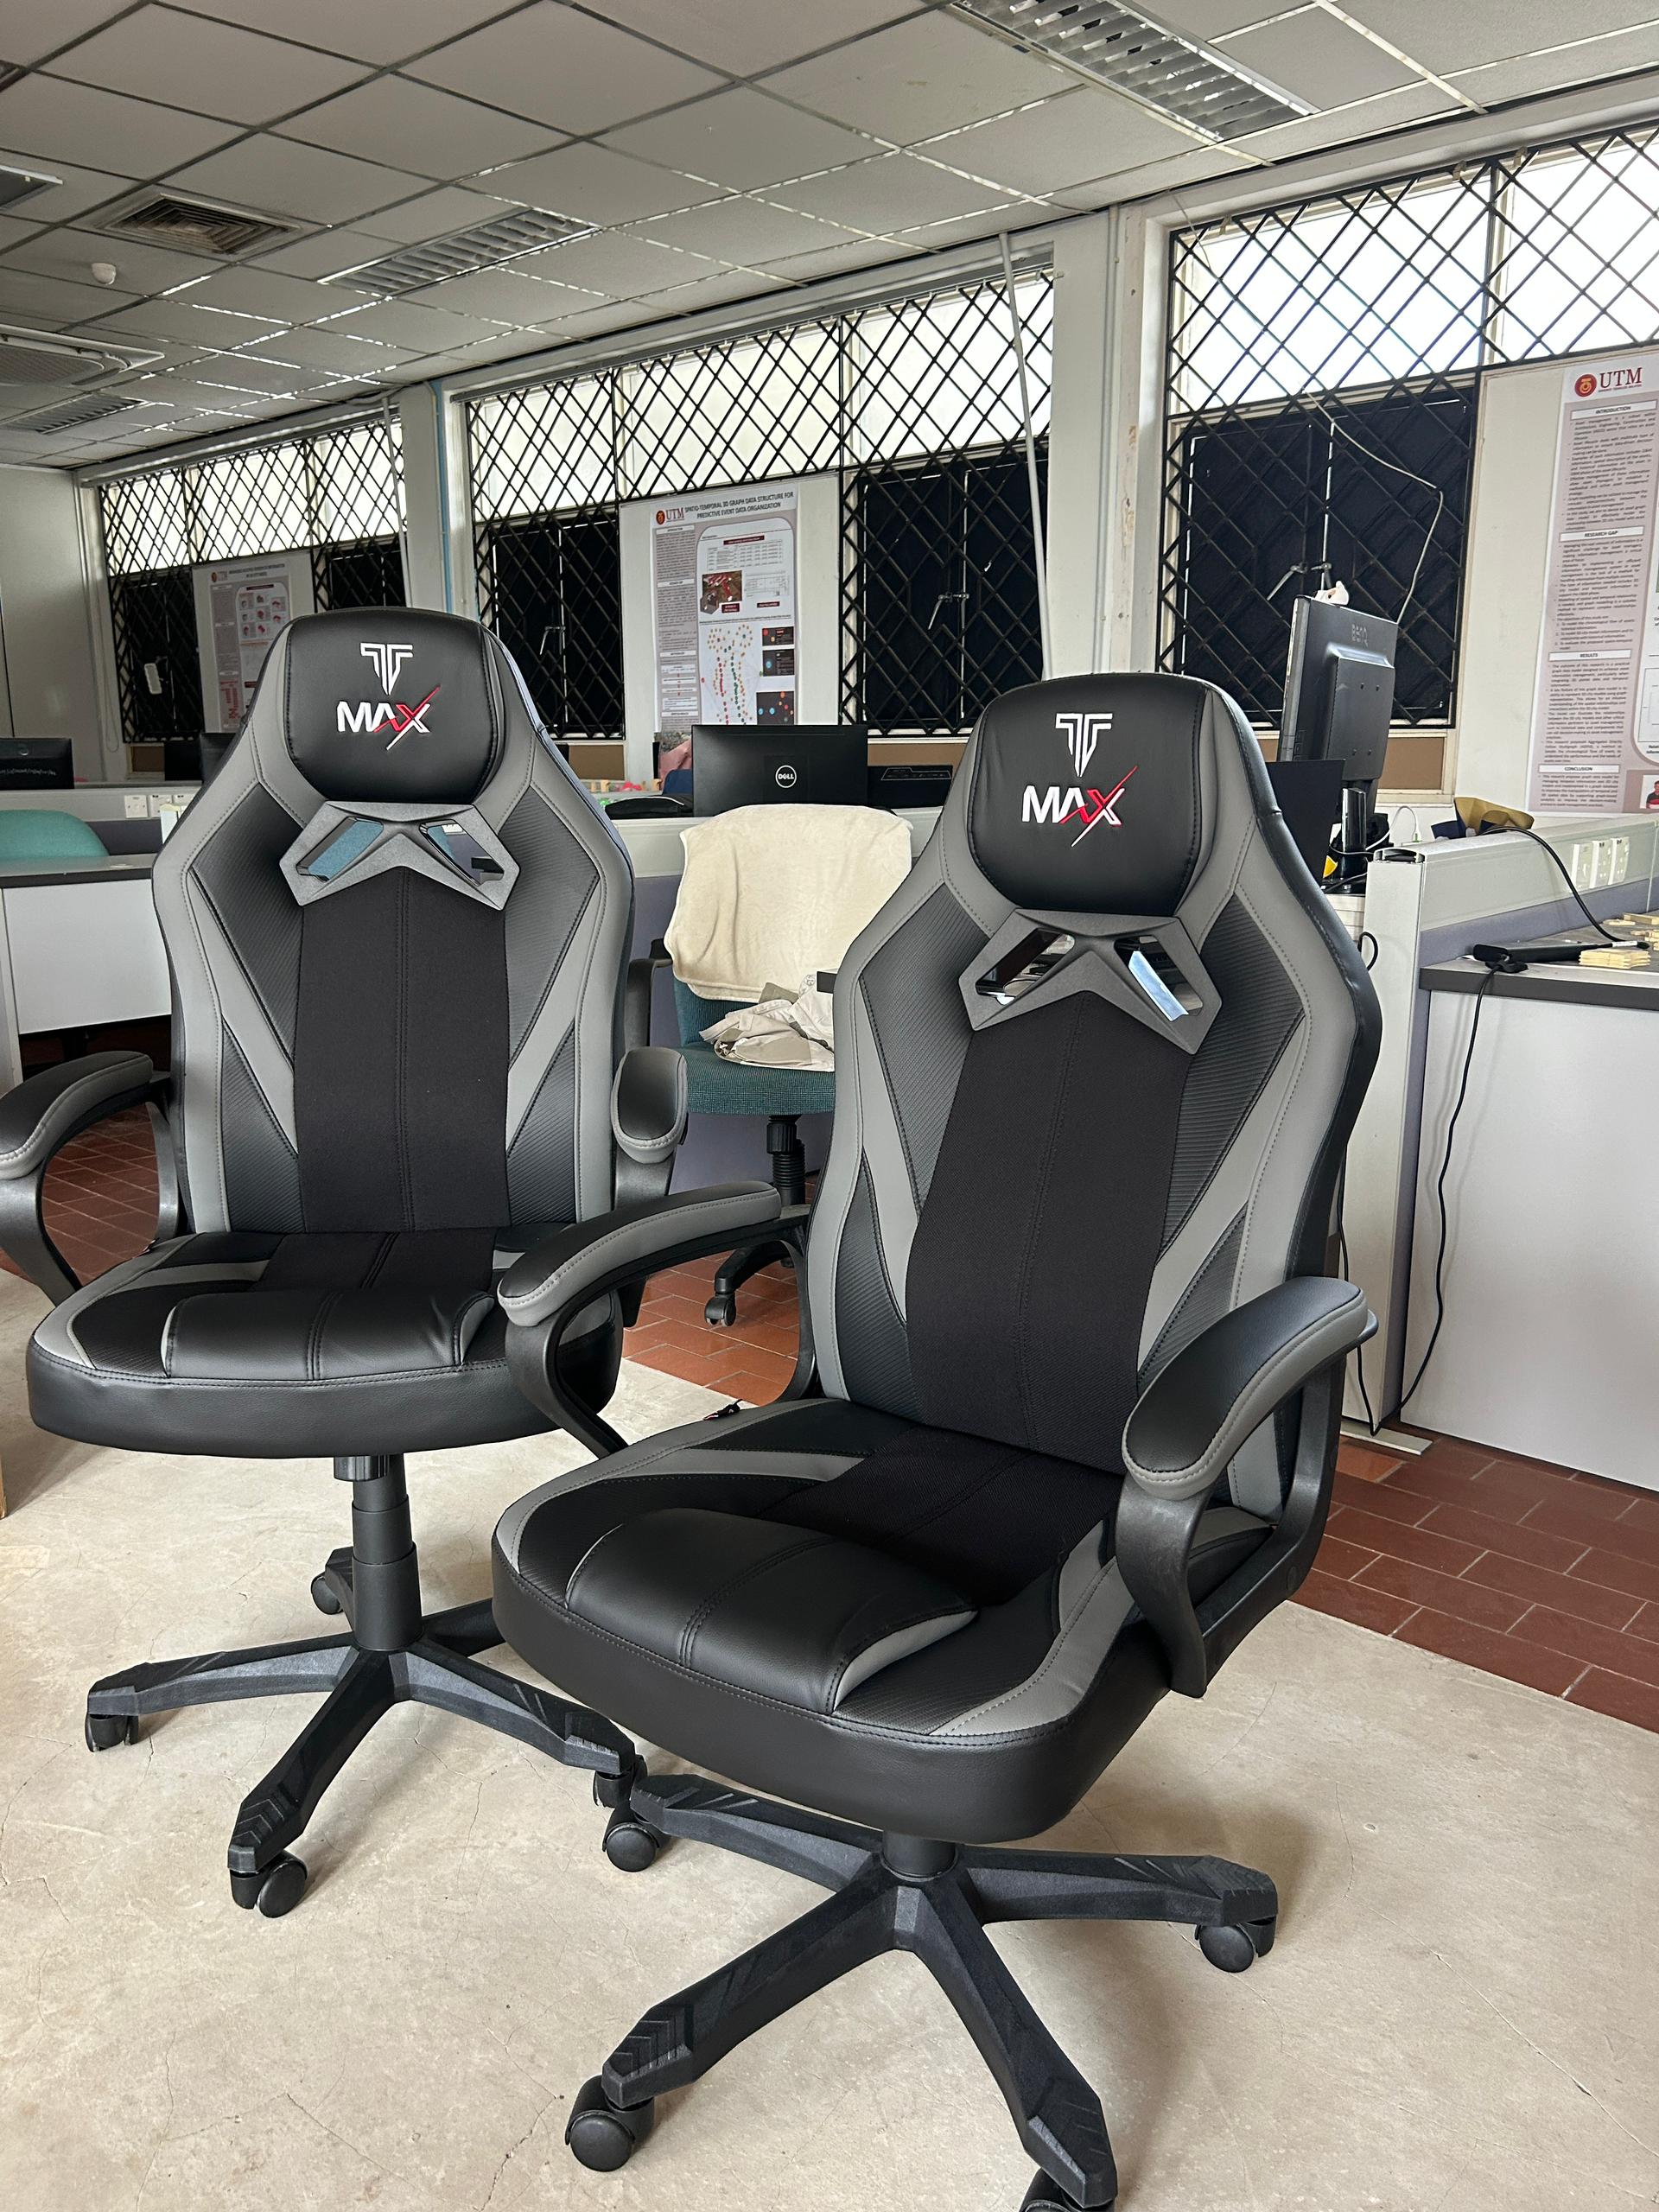
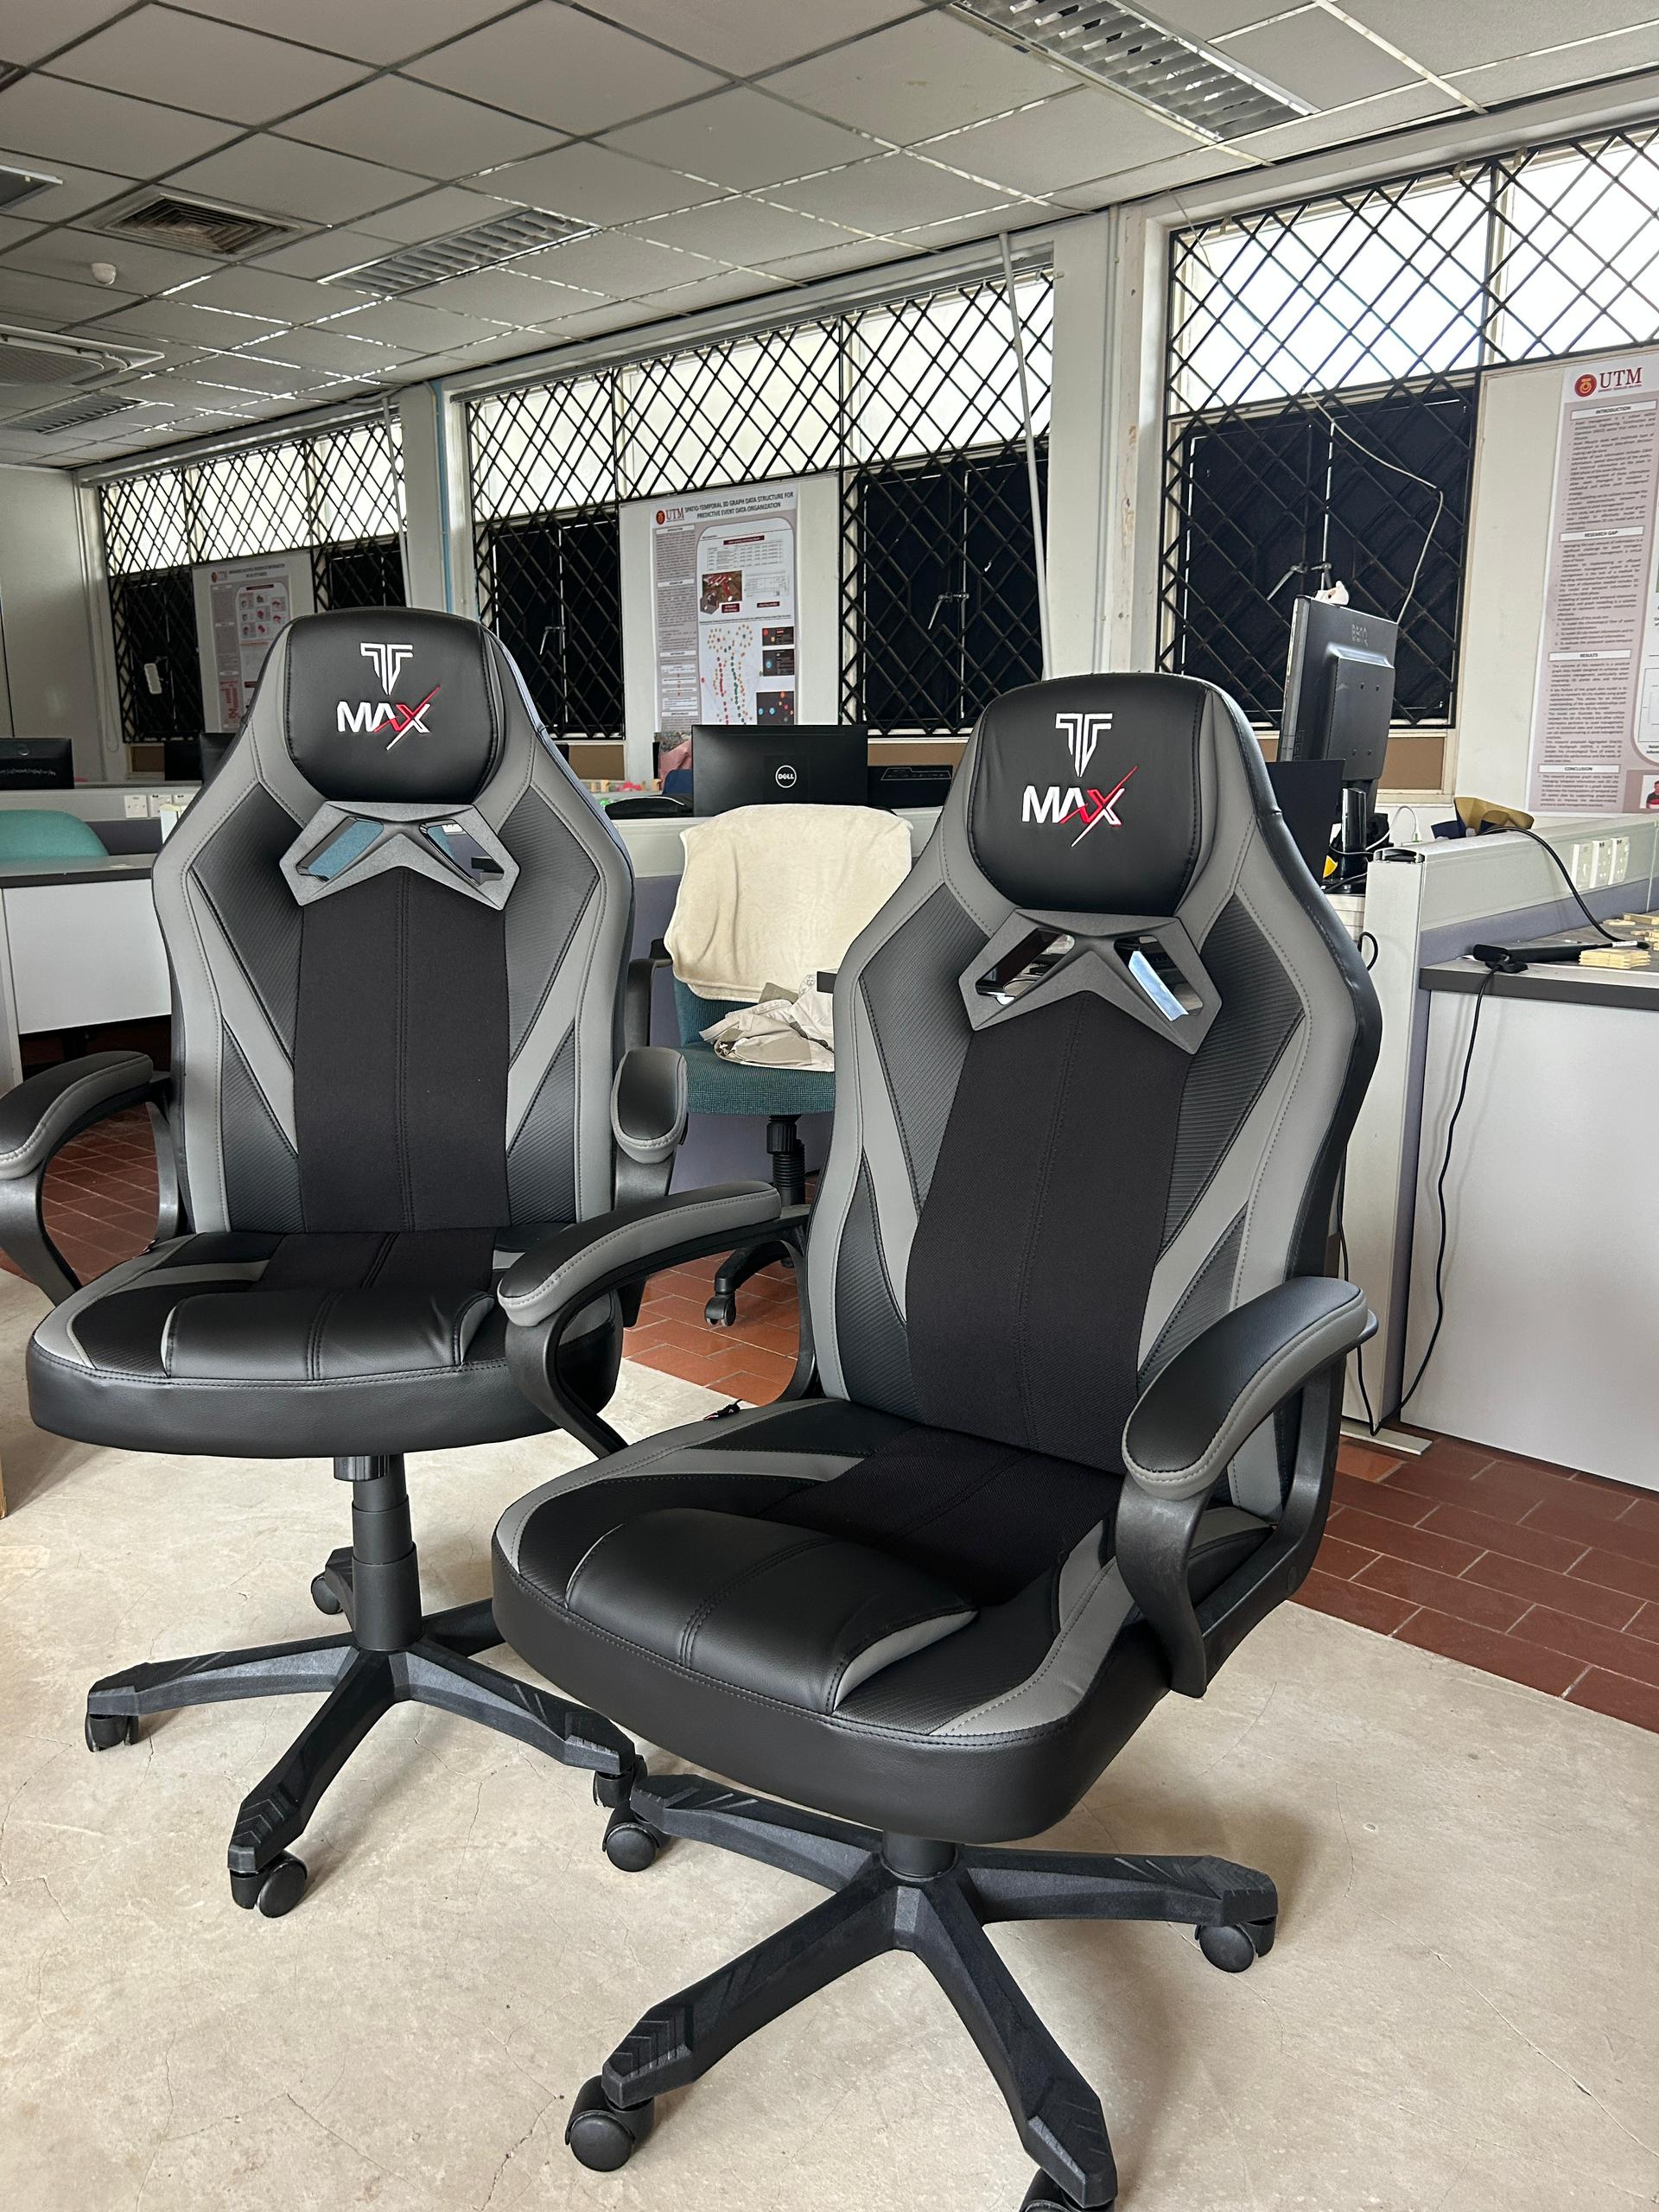
Watching my postgraduate students sit on old chairs every day made me think, “If I can make their journey just a little more comfortable, why not?”

Gaming chairs aren’t exactly cheap, and I understand why the university can’t simply buy them for every lab. So, I decided to slowly get them using my own funds.

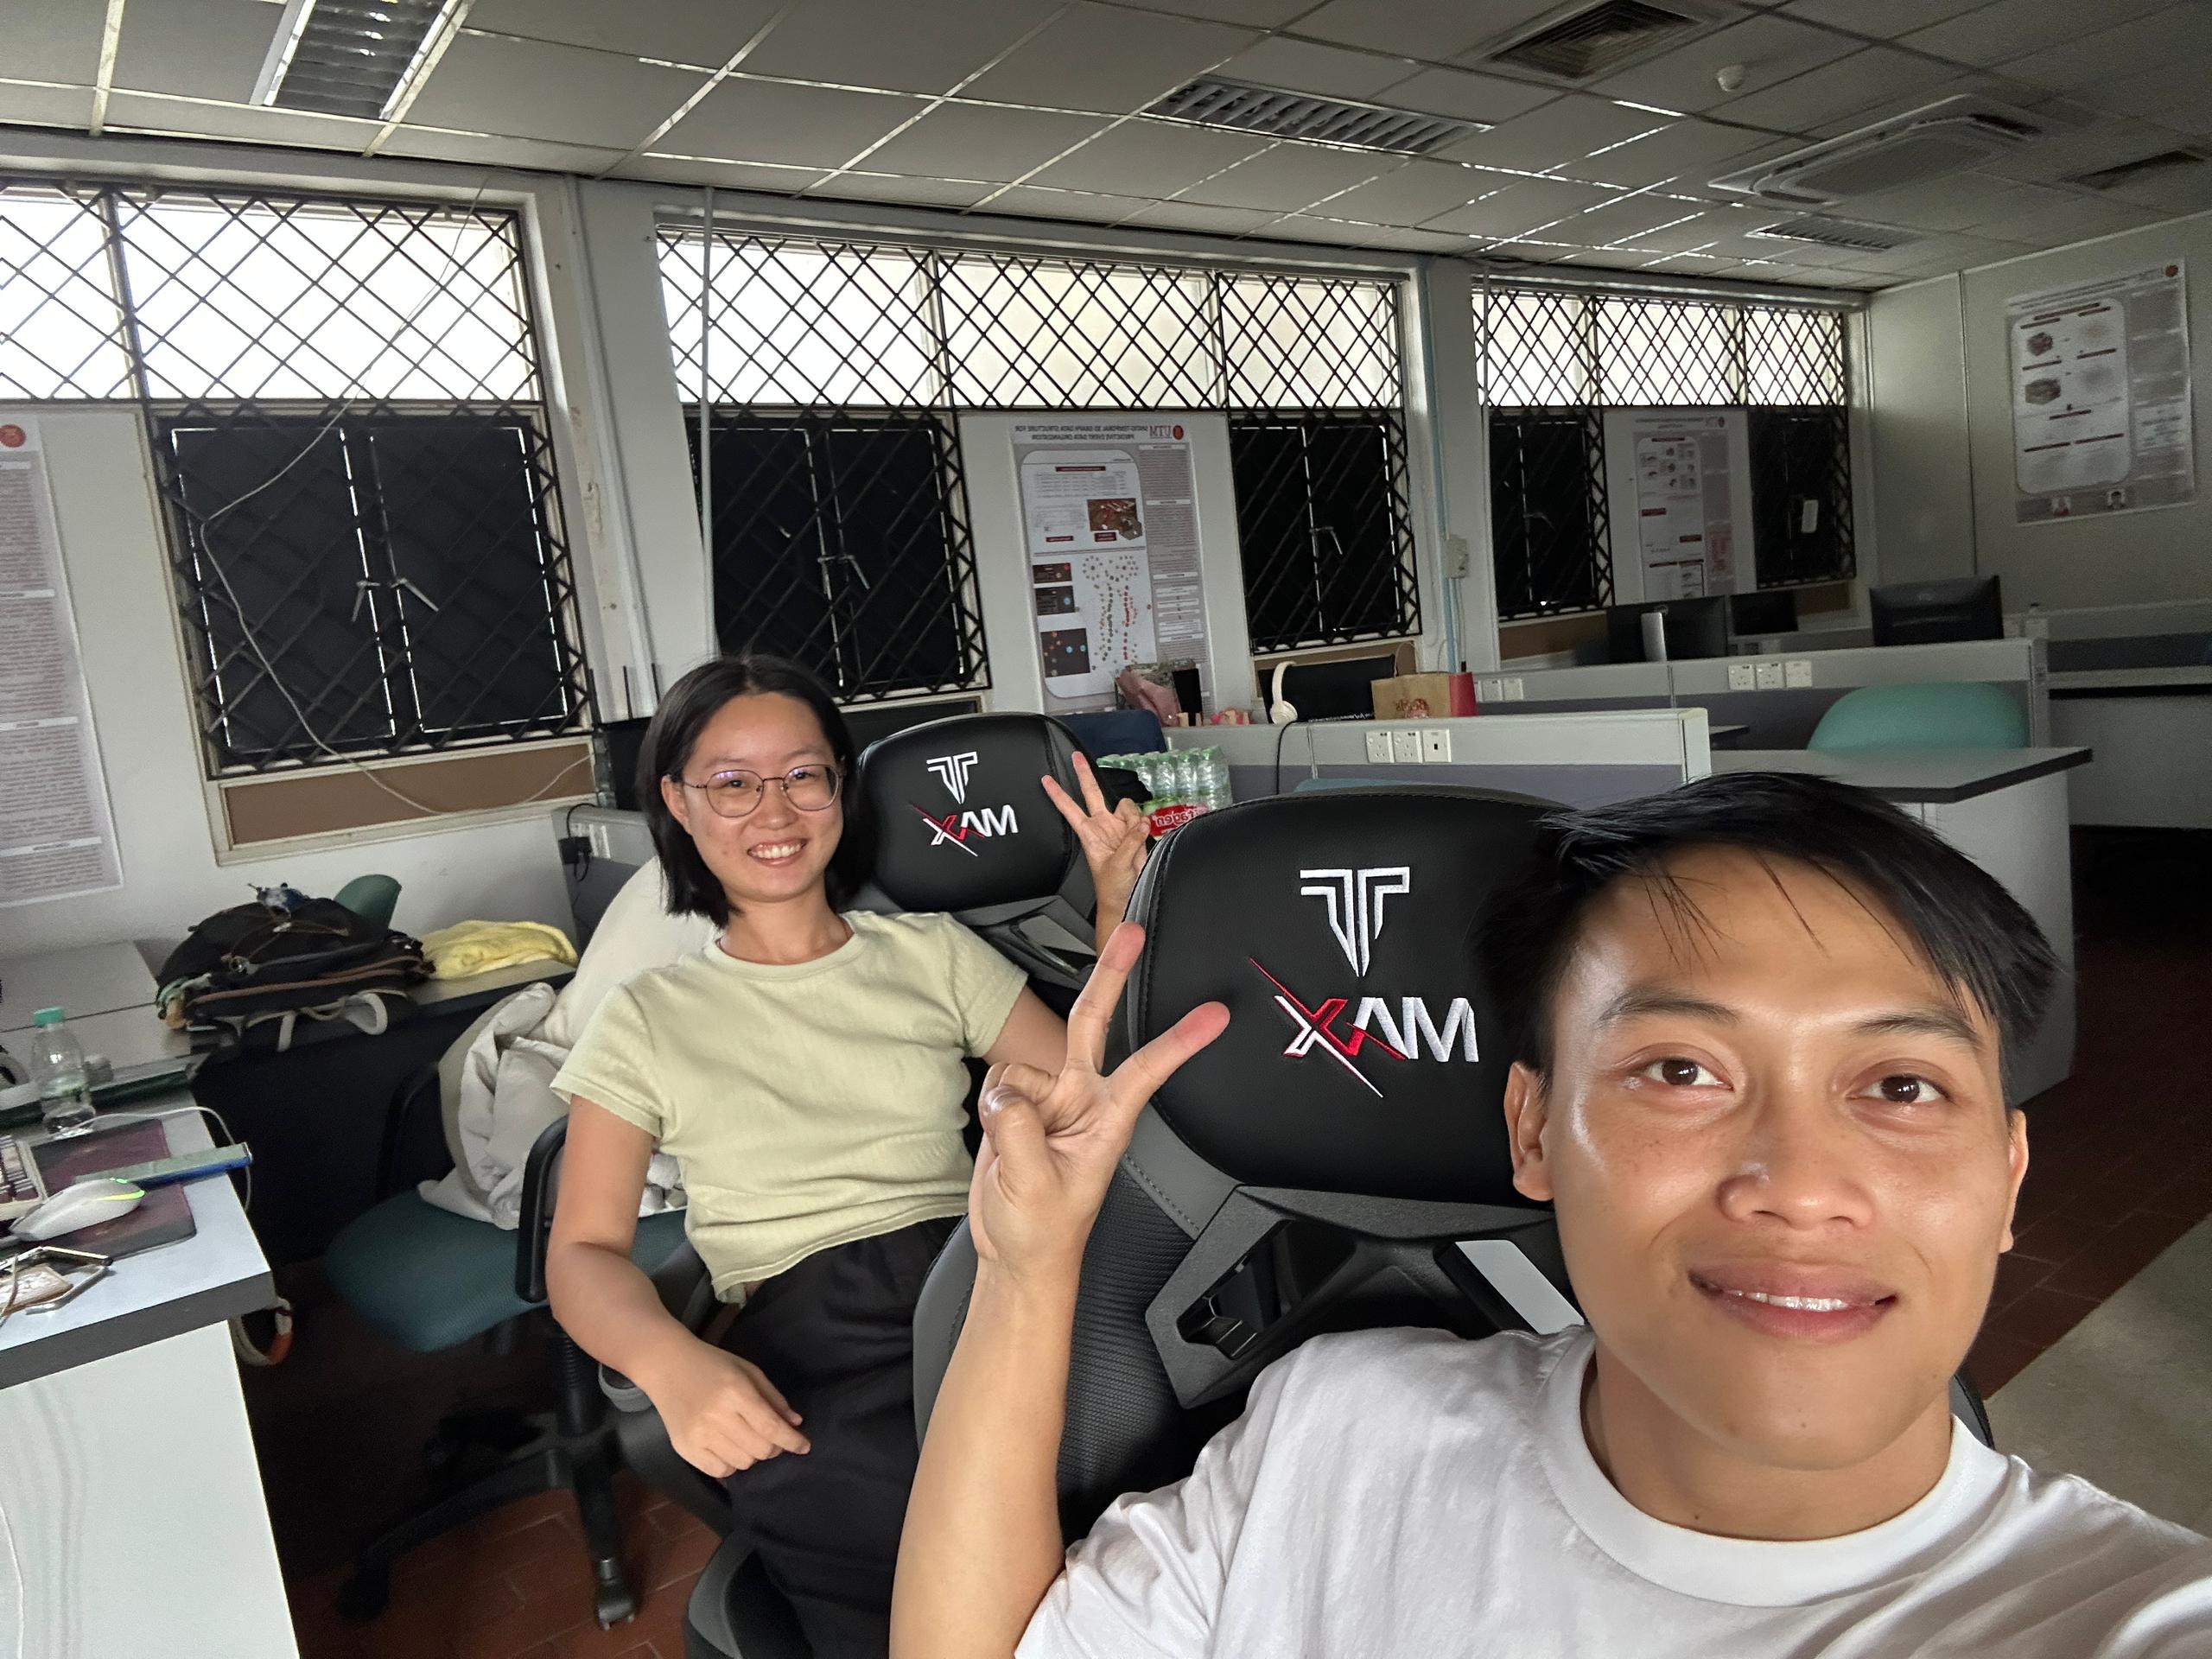
We bought four before, and this weekend we welcomed two more. One step at a time. ❤️

A huge thank you to Wiliyan from Sarawak 🇲🇾 and Yiming from China 🇨🇳 for assembling them over the weekend. It didn’t take them long… then again, if you’re doing a PhD, assembling a gaming chair should be one of the easier challenges. 😂

Research is already hard enough. If I can help reduce even a little bit of their discomfort, it’s worth it.

Sometimes, supporting students isn’t about doing something big.

It’s about noticing the little things that make a big difference.

#PhDLife #ResearchLife #StudentSupport #AcademicLife #LabLife

FROM MAPPING TRENDS TO BUILDING BENCHMARKS

FROM MAPPING TRENDS TO BUILDING BENCHMARKS

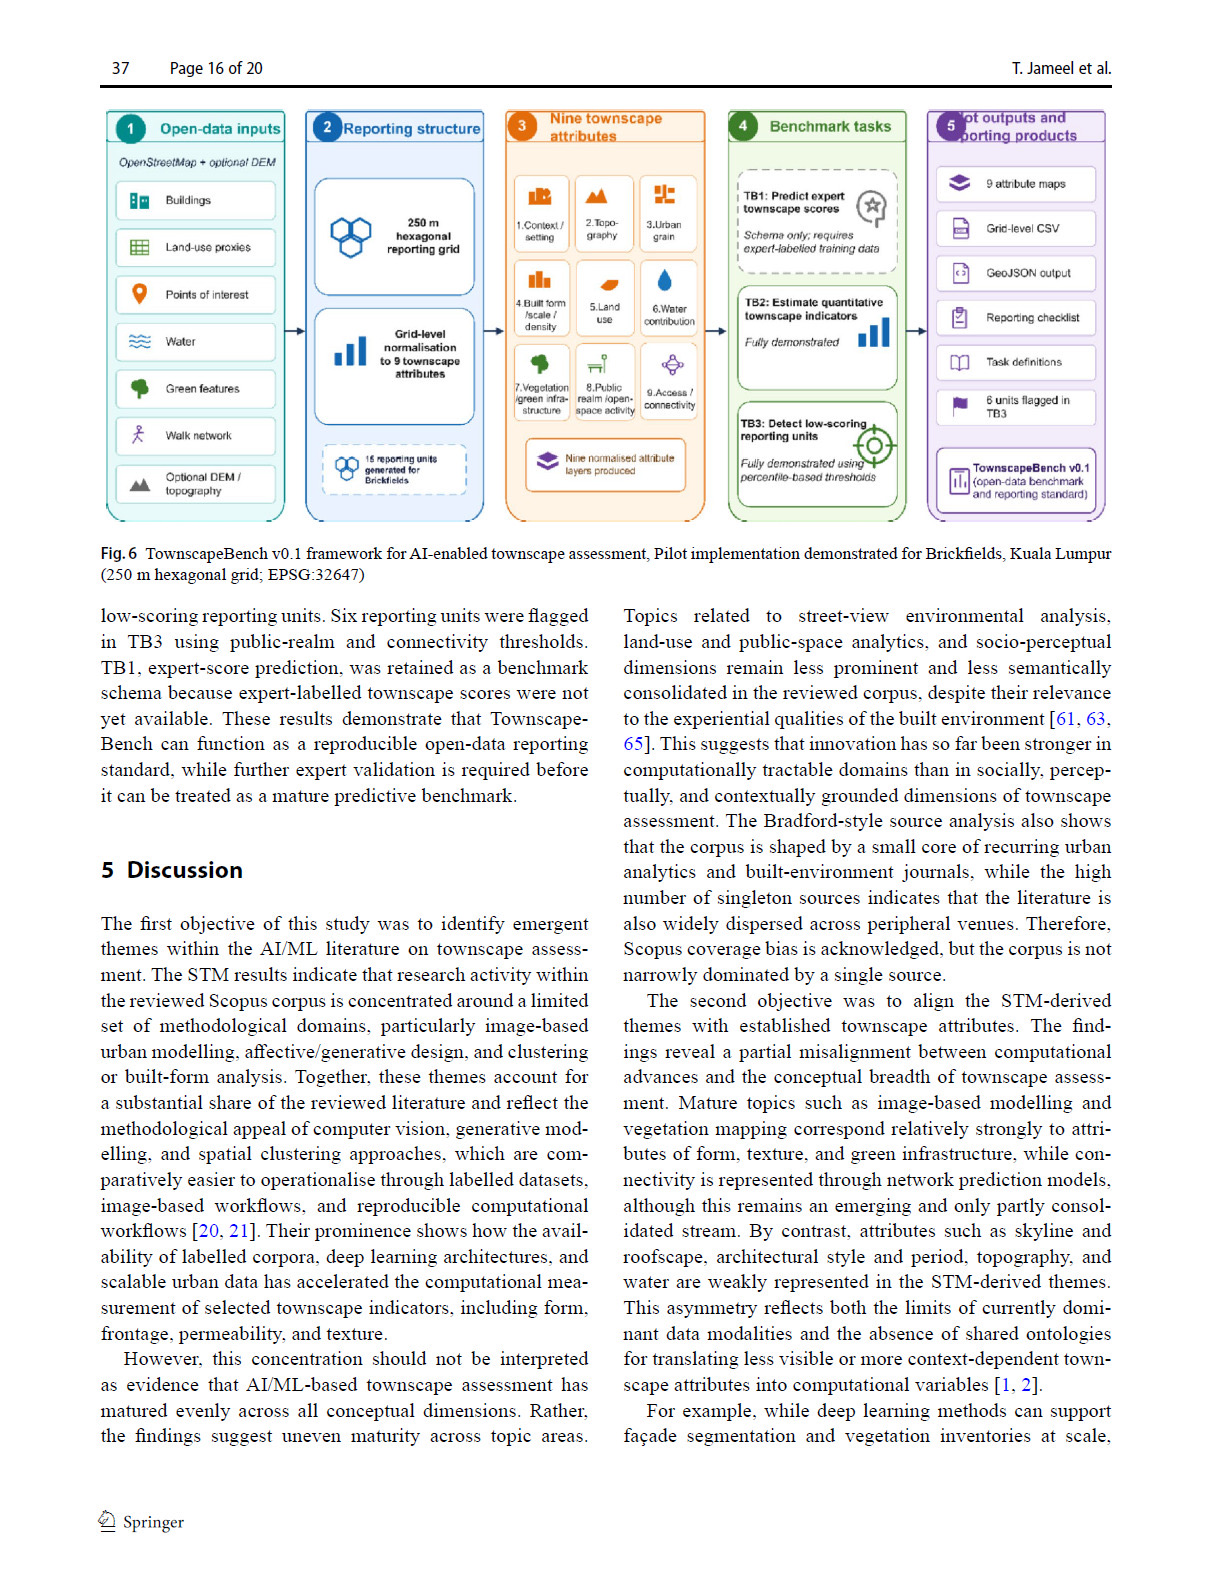
This is our latest review paper that has been published in Spatial Information Research (Springer) journal.

Title:

Using Structural Topic Modelling to Identify Fragmentation and Integration in AI-Driven Townscape Assessment

As Artificial Intelligence continues to reshape urban analytics, we wanted to answer a simple but important question:

Where is the field of AI-driven townscape assessment heading?

To answer this, we systematically reviewed research published between 2007 and 2025 and applied Structural Topic Modelling (STM) to uncover how the field has evolved over time.

Our findings revealed that while areas such as image-based urban modelling, LiDAR, point cloud processing, vegetation mapping, and urban clustering have matured significantly, several important aspects of townscape assessment, including architectural style, skyline, topography, and water-related attributes, remain underexplored.

One of the key outcomes of this study is the introduction of TownscapeBench v0.1, an open reporting framework designed to improve the reproducibility and benchmarking of AI-enabled townscape assessment. We hope this framework will serve as a useful reference for researchers working at the intersection of Artificial Intelligence, Machine Learning, Computer Vision, GIS, and Urban Analytics.

Research is not only about developing new algorithms. Sometimes, it is equally important to step back, understand where a field currently stands, identify existing gaps, and provide a roadmap for future research.

My sincere appreciation goes to my team for the excellent collaboration. I look forward to seeing how this work contributes to the next generation of AI-driven urban and geospatial research.

📄 Read the paper here:

https://doi.org/10.1007/s41324-026-00696-7

#ArtificialIntelligence #MachineLearning #Townscape #UrbanAnalytics #GIS

A SIMPLE “YES” TO HELPING A COLLEAGUE

A SIMPLE “YES” TO HELPING A COLLEAGUE

Sometimes, the best opportunities begin with a simple message.

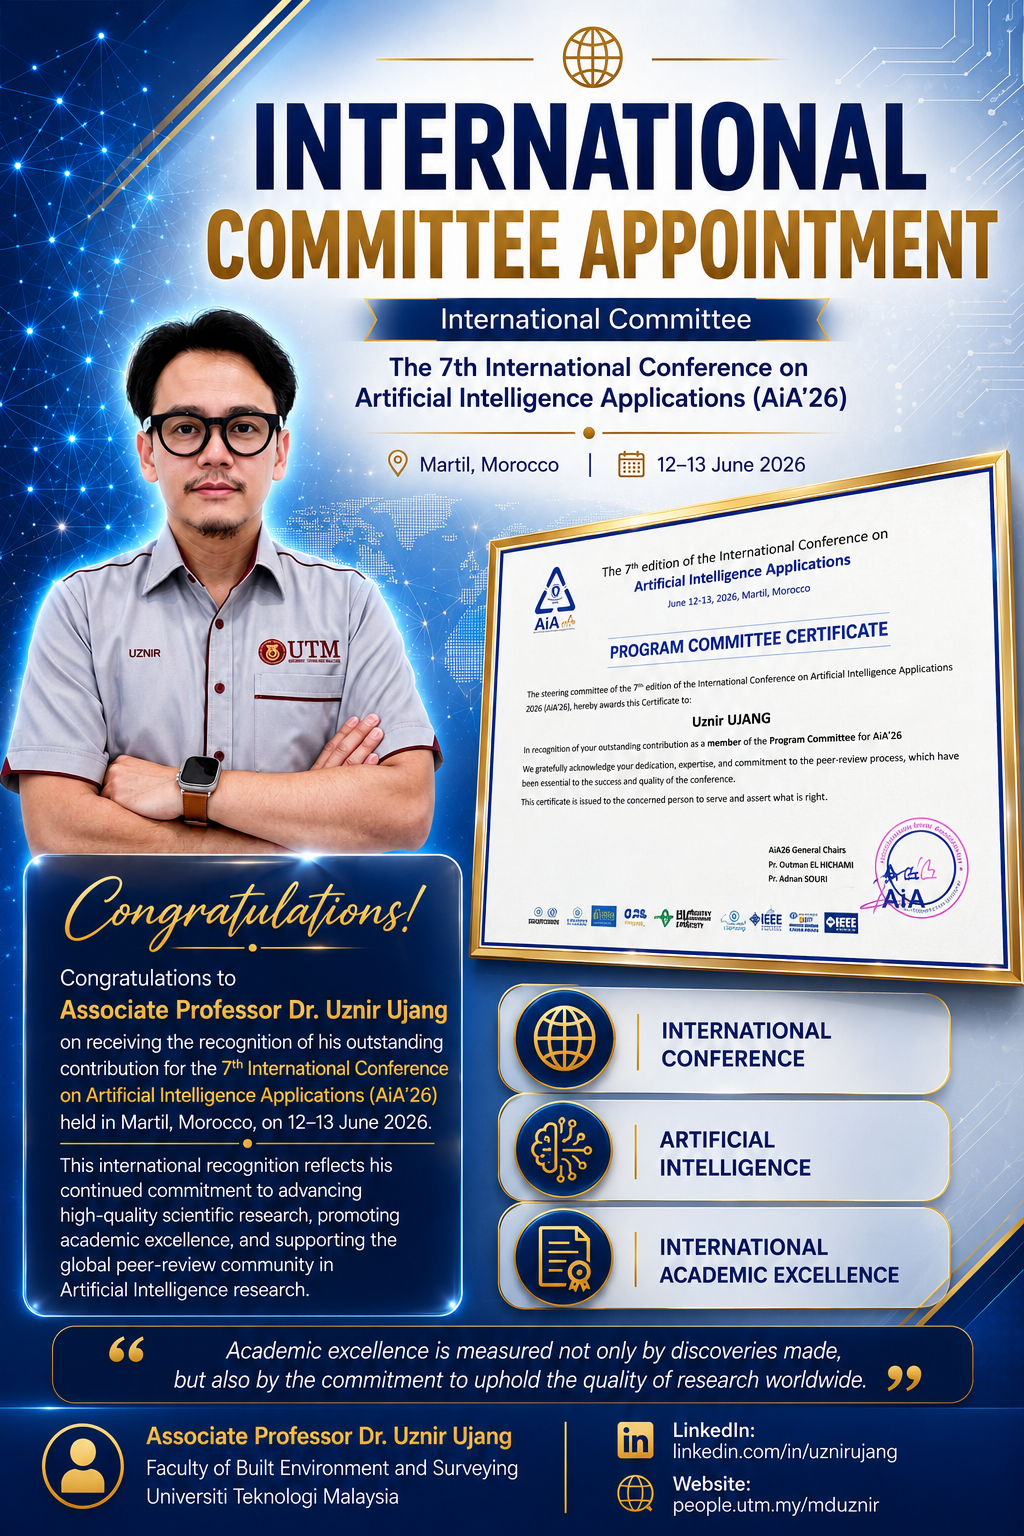
Earlier this year, a colleague from Morocco reached out and asked whether I would be willing to support the 7th International Conference on Artificial Intelligence Applications (AiA’26) as a member of the International Program Committee.

Of course, I was happy to help.

Academic research has always been built on collaboration. Whether it is reviewing conference papers, evaluating research quality, or sharing ideas, every contribution helps strengthen the scientific community.

This year, I had the privilege of serving on the International Program Committee for AiA’26, contributing to the peer review process alongside researchers from around the world. It is always a rewarding experience to read new ideas, provide constructive feedback, and help ensure that only high-quality research is presented at the conference.

Artificial Intelligence continues to transform many aspects of our lives, making conferences like AiA an important platform for researchers to exchange ideas, build collaborations, and showcase innovative solutions to real-world challenges.

I sincerely thank the organising committee for the invitation and for this certificate of appreciation. I truly appreciate the trust they have placed in me.

I hope this will be the beginning of many more collaborations with colleagues from Morocco and other parts of the world.

After all, science grows stronger when we help one another.

#ArtificialIntelligence #InternationalCollaboration #AcademicService #PeerReview #Morocco

AN IMPORTANT MILESTONE IN A PhD JOURNEY

AN IMPORTANT MILESTONE IN A PhD JOURNEY

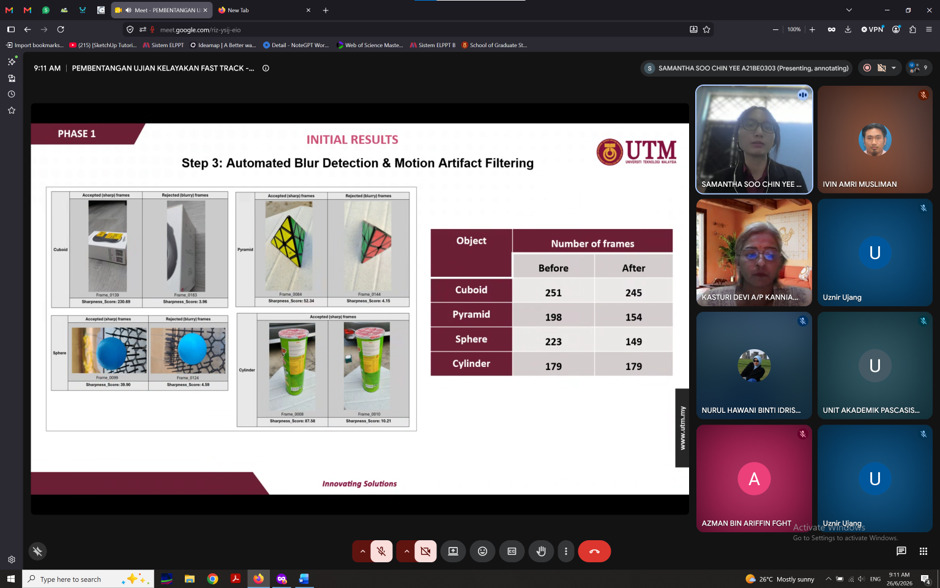
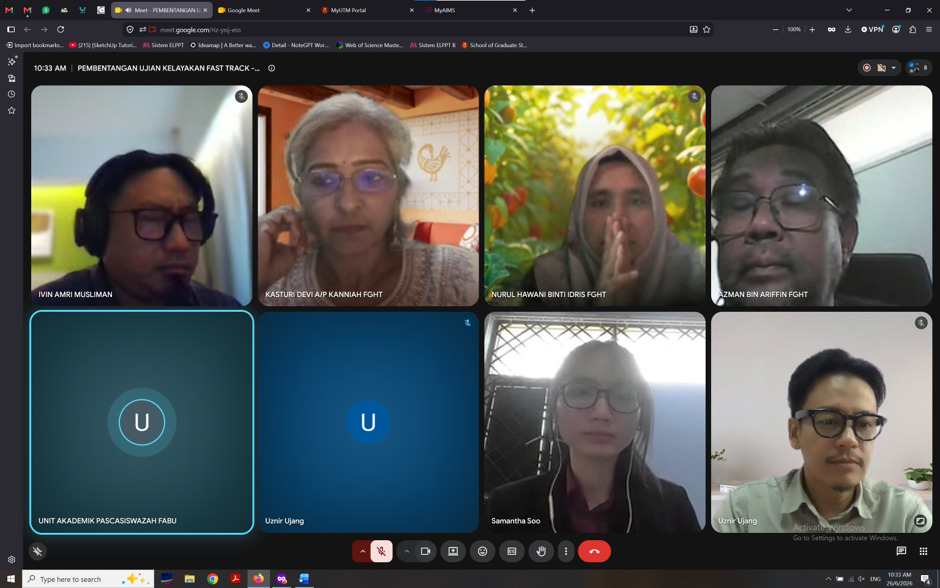
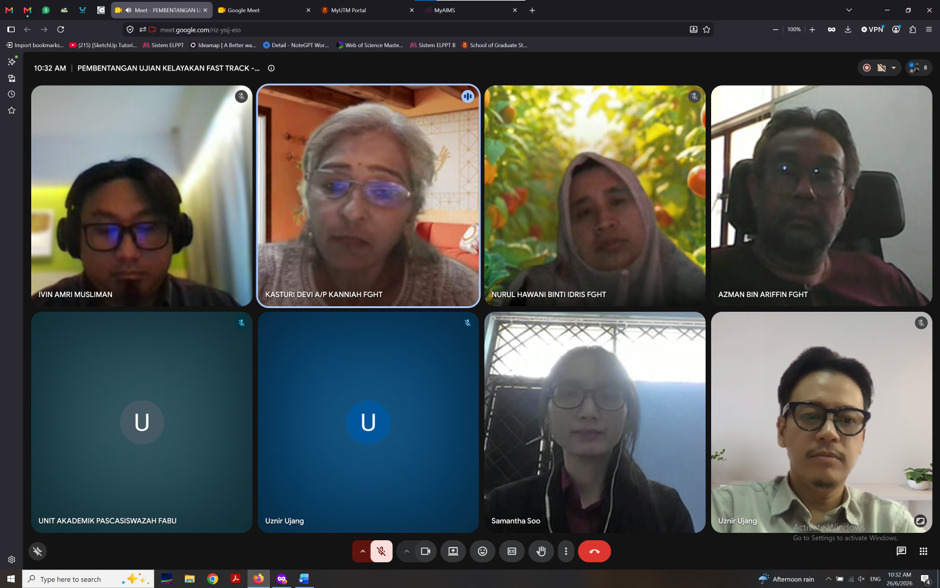
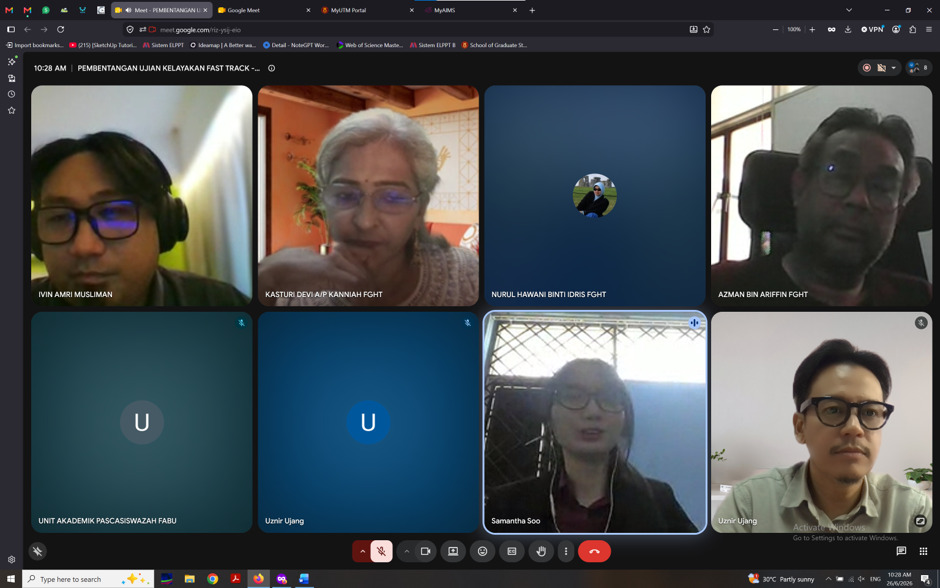
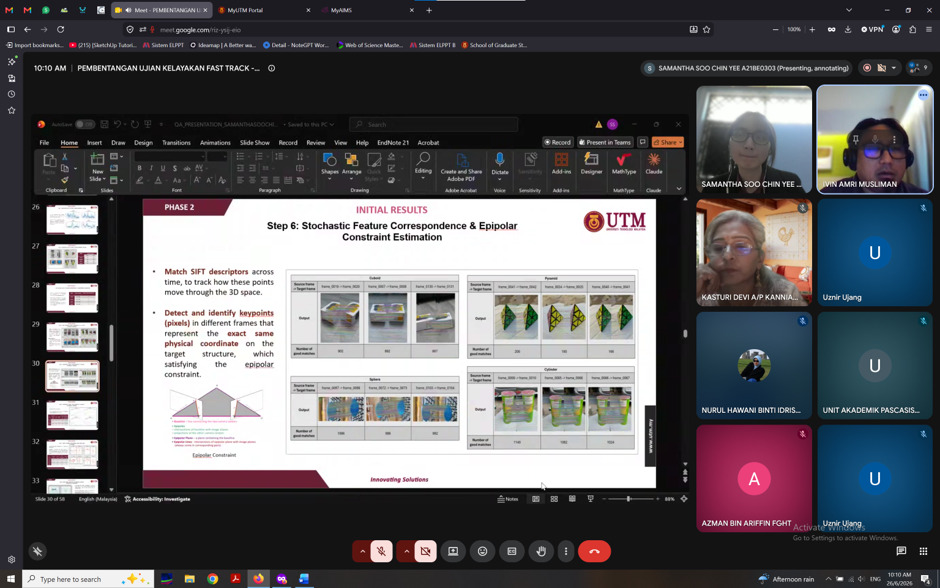
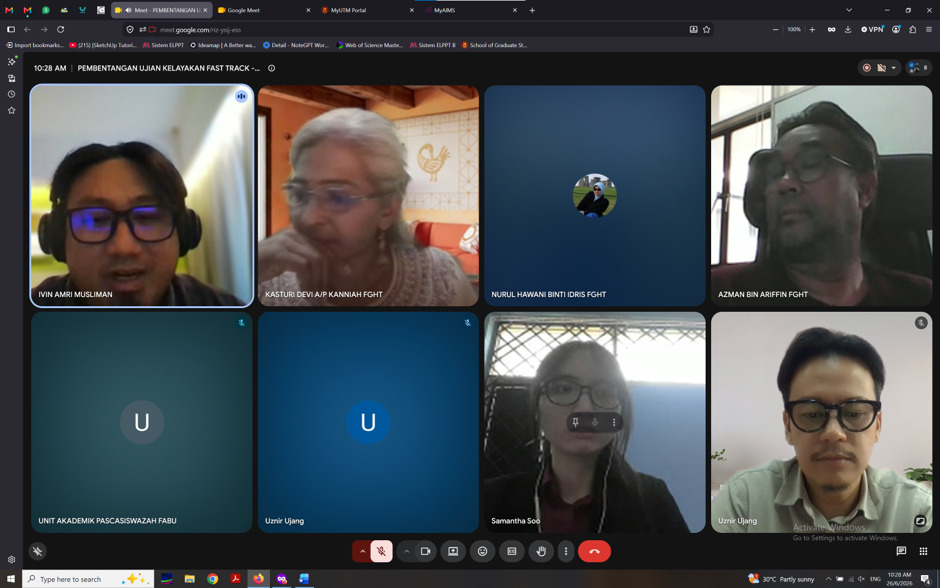
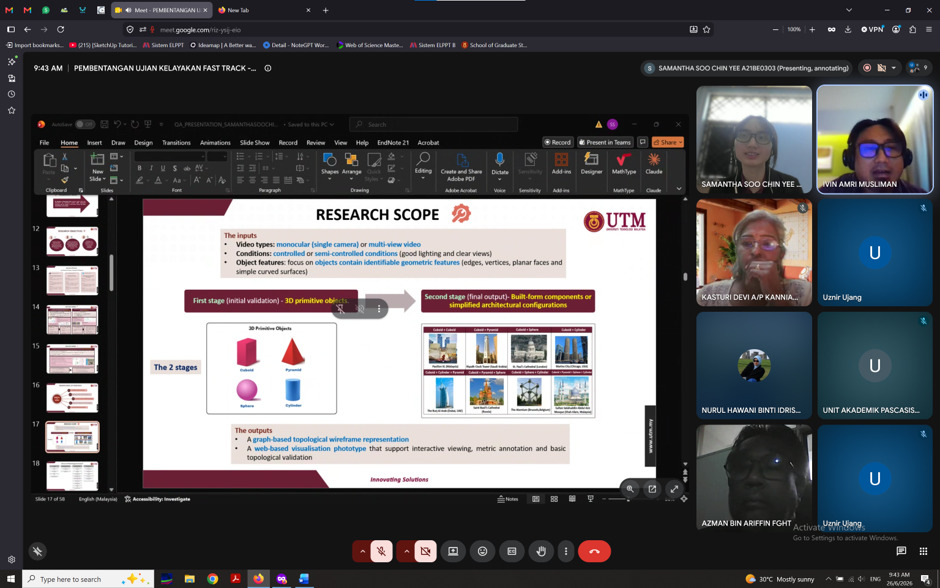
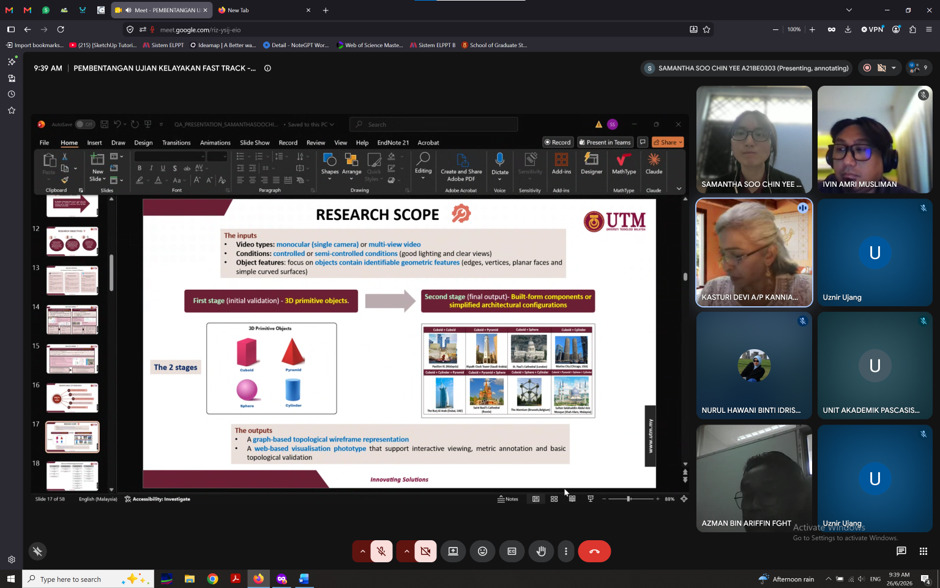
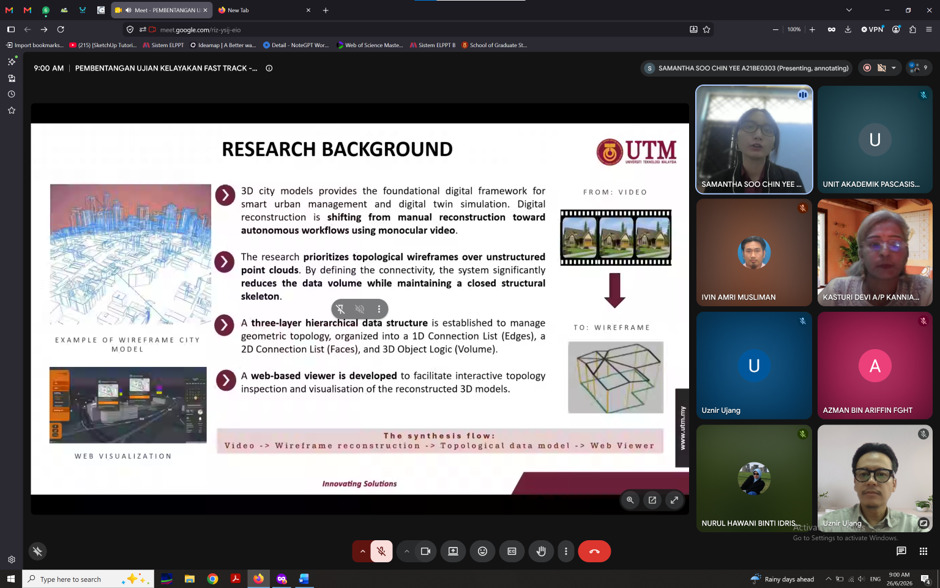
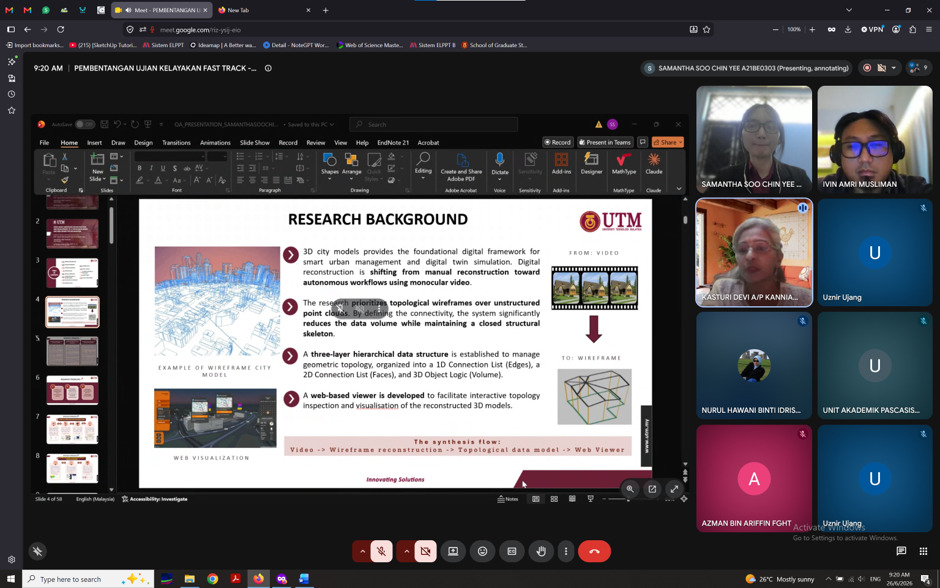
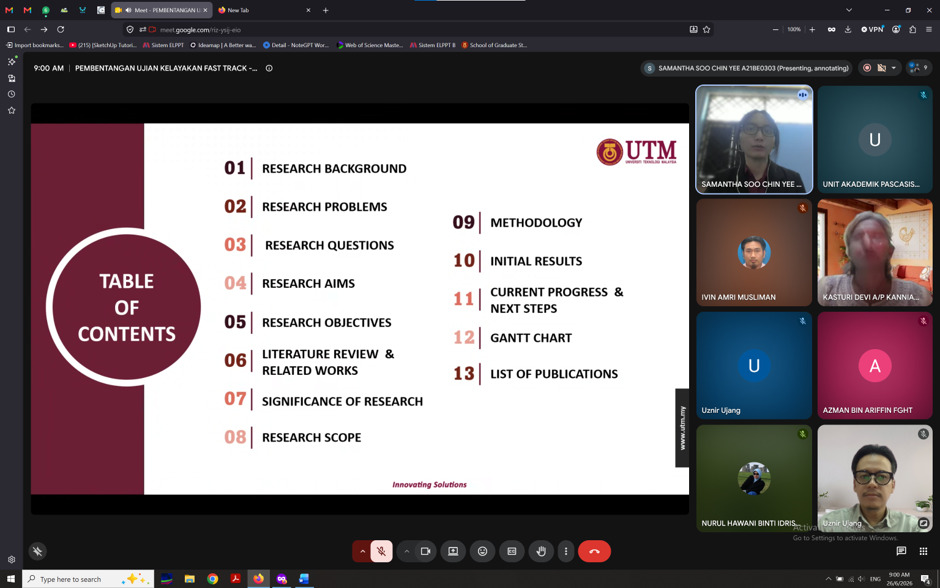
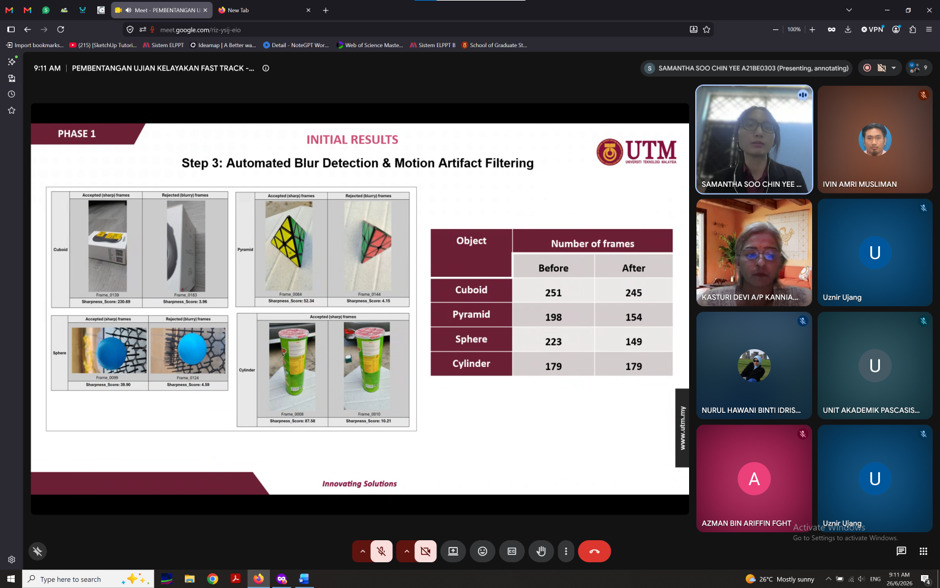
Congratulations to my PhD student, Samantha Soo Chin Yee, on successfully passing her PhD Qualification Assessment (QA).

The Qualification Assessment is one of the most important milestones in a PhD journey. It is not simply another presentation. It is a formal assessment where the candidate must convince a panel of examiners that the research is original, scientifically sound, feasible, and has sufficient novelty to continue as a PhD project. Passing the QA means the student has demonstrated the capability to carry out independent doctoral research.

I am especially proud because Samantha achieved this milestone in just her 8th month as a PhD student.

According to the chairman, she answered the examiners’ questions confidently, and the panel acknowledged both the novelty and significance of her research. Better yet, the entire QA session was completed in only 1 hour and 20 minutes, including a 19-minute presentation, which reflects her excellent preparation and clear understanding of her work.

Looking back, it has been an incredible start to her PhD journey. Within her first year, Samantha has already:

  • Published a paper in the ISPRS Archives indexed in Web of Science.
  • Collaborated with researchers from Karabük University, Türkiye, and an industry partner from Spain.
  • Successfully passed her PhD Qualification Assessment.

These achievements did not happen by chance. They are the result of consistent effort, discipline, and a willingness to learn.

Congratulations once again, Samantha. This is only the beginning of your PhD journey, and I look forward to seeing your research continue to grow and make meaningful contributions to the geospatial community.

Keep up the excellent work. The best is yet to come.

#PhD #QualificationAssessment #Research #GeospatialScience #UTM

TRUST ISSUE – DON’T USE GIS DATA BLINDLY

TRUST ISSUE – DON’T USE GIS DATA BLINDLY

Would you trust a map if you didn’t know where it came from?

Imagine downloading a GIS dataset that looks perfect.

It has roads, buildings, rivers, and land parcels. Everything seems ready to use.

But then the questions start.

❓ Who created it?

❓ When was it last updated?

❓ How accurate is it?

❓ Which coordinate system does it use?

❓ Can you trust it for your analysis?

Without metadata, you have no answers.

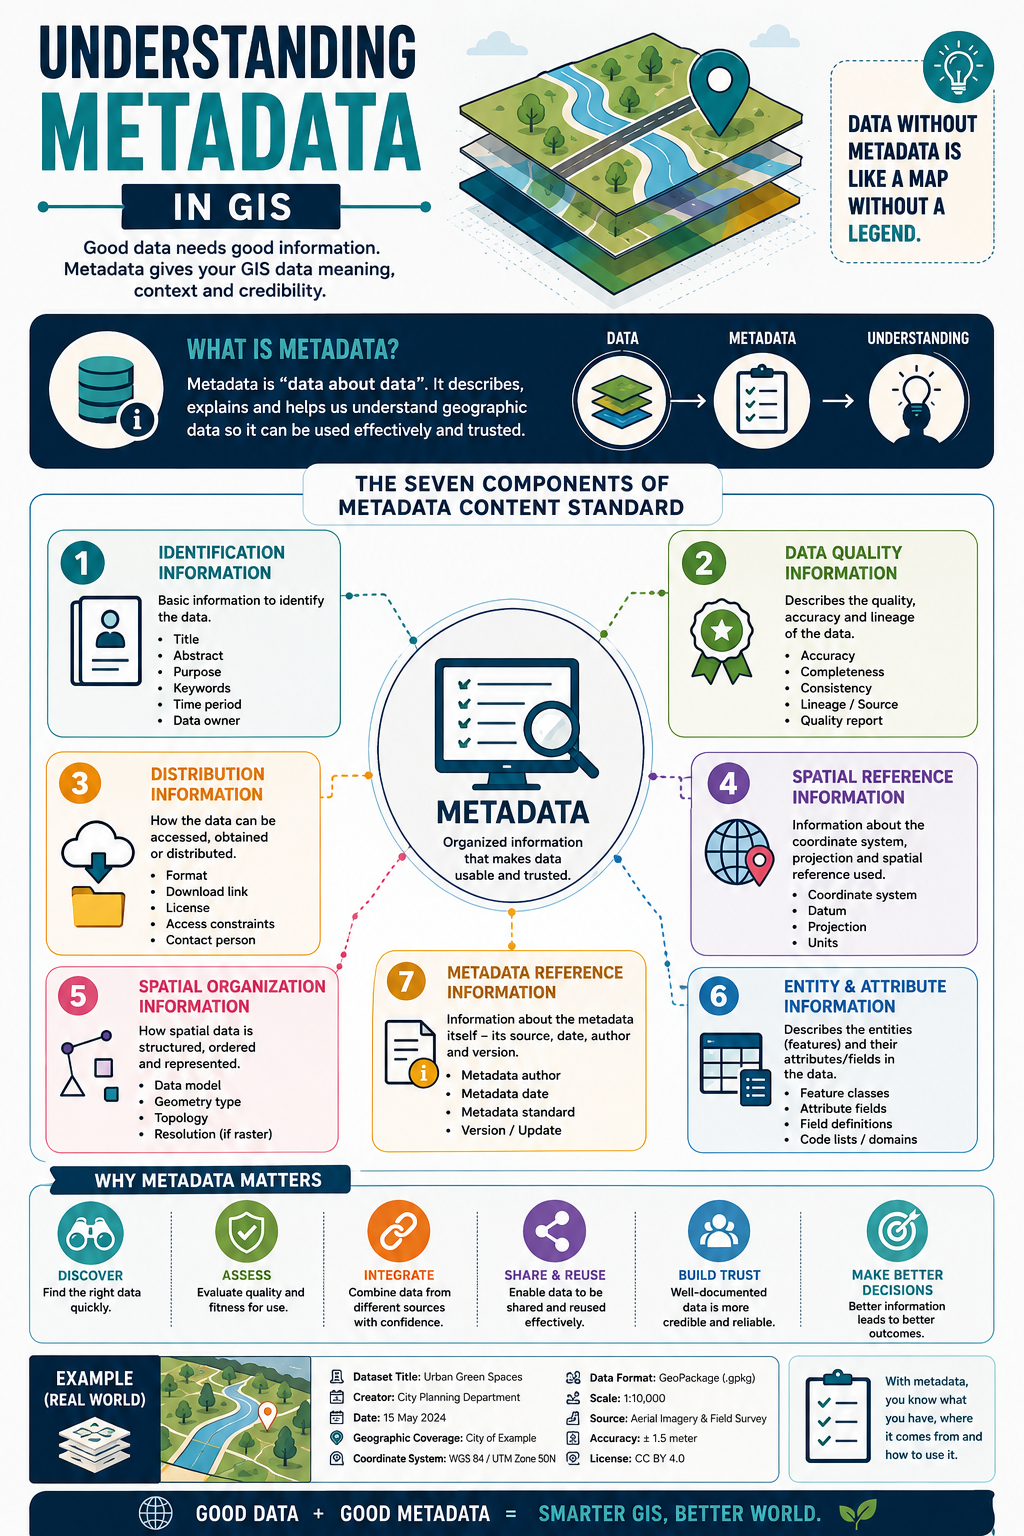
That’s why metadata is often called “data about data.” It provides the information needed to understand, evaluate, and confidently use a GIS dataset.

Good metadata tells you:

📌 What the dataset contains

📌 Who created it

📌 When it was collected or updated

📌 Where it covers

📌 How it was produced

📌 How accurate it is

📌 How you can access, share, and reuse it

Think of metadata as the instruction manual for your GIS data.

Without it, even the best dataset can become confusing, unreliable, or impossible to use correctly.

Why is metadata important?

✅ Helps you discover the right dataset faster

✅ Allows you to assess data quality and suitability

✅ Makes it easier to integrate data from different sources

✅ Encourages data sharing and reuse

✅ Builds confidence and trust in your analysis

A simple way to remember it:

📍 Data tells you the answer.

📋 Metadata tells you whether you should trust the answer.

The next time you download a GIS dataset, don’t just open the map.

Open the metadata first.

It might be the most valuable information in the entire dataset.

Have this in mind when you look at neat datasets, “it’s too good to be true” 😊

#GIS #Metadata #Geospatial #SpatialData #GISLearning

AN AFTERNOON OF FUTURE GIS RESEARCH
AN AFTERNOON OF FUTURE GIS RESEARCH
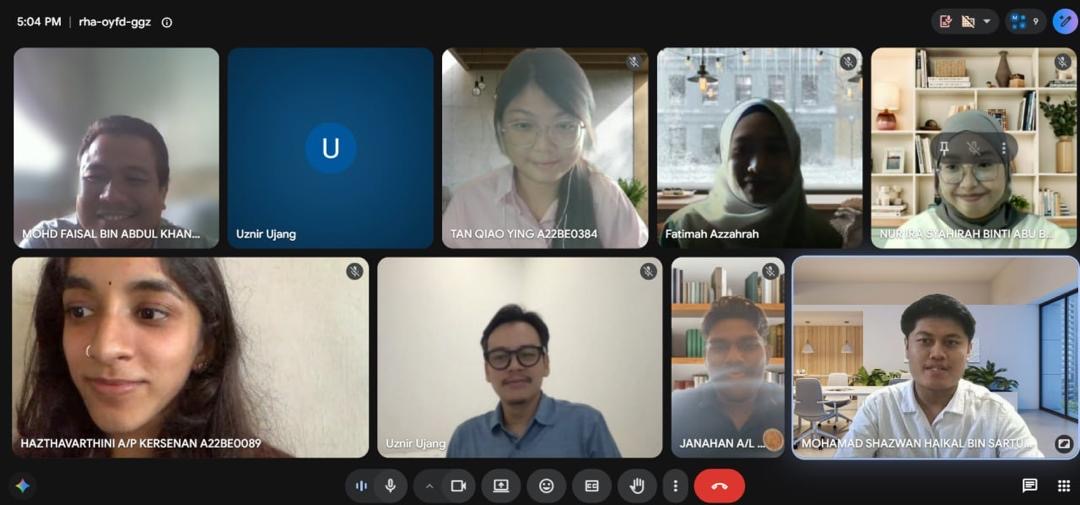
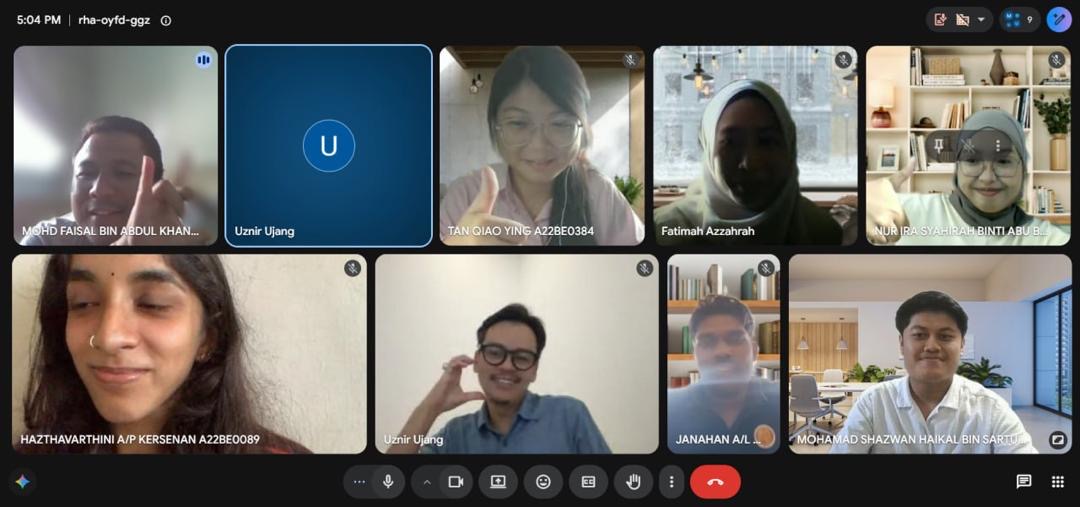
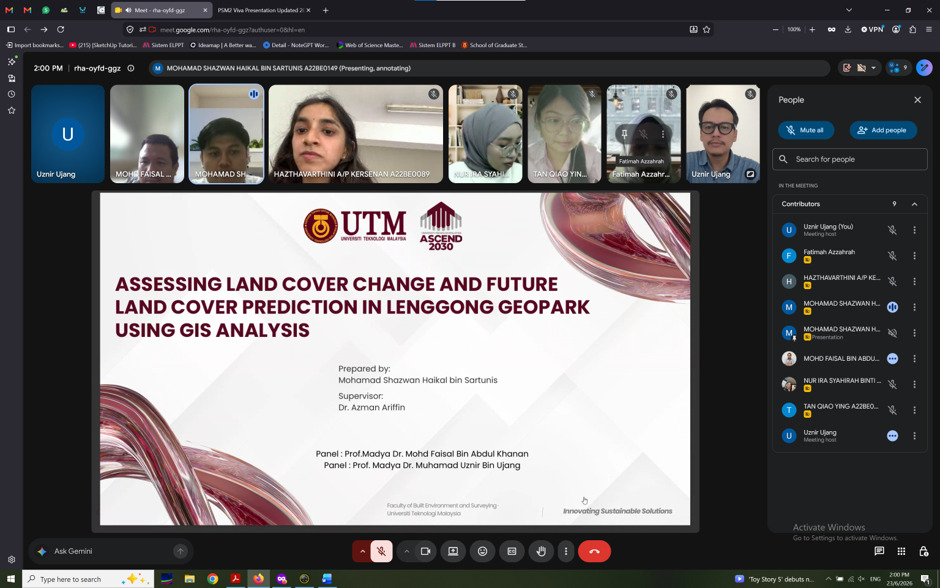
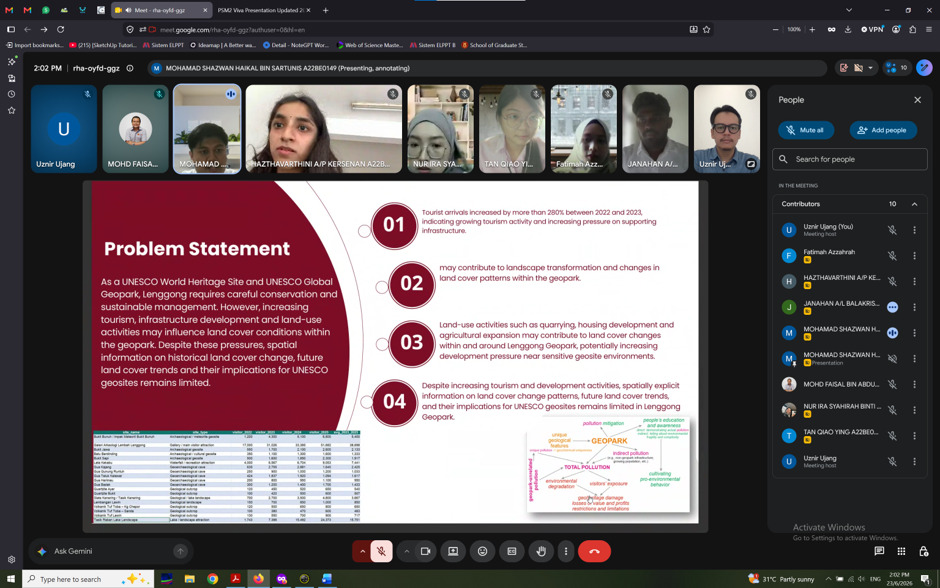
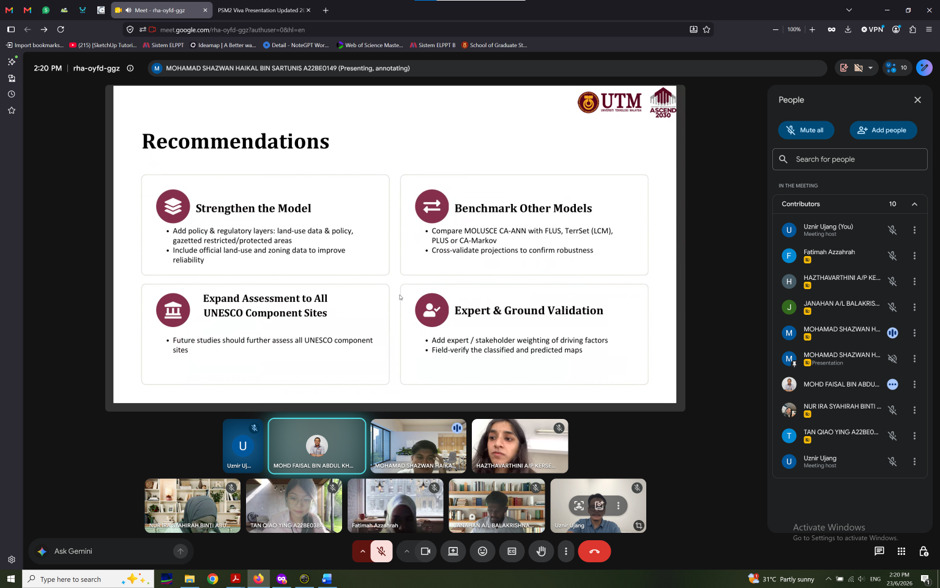
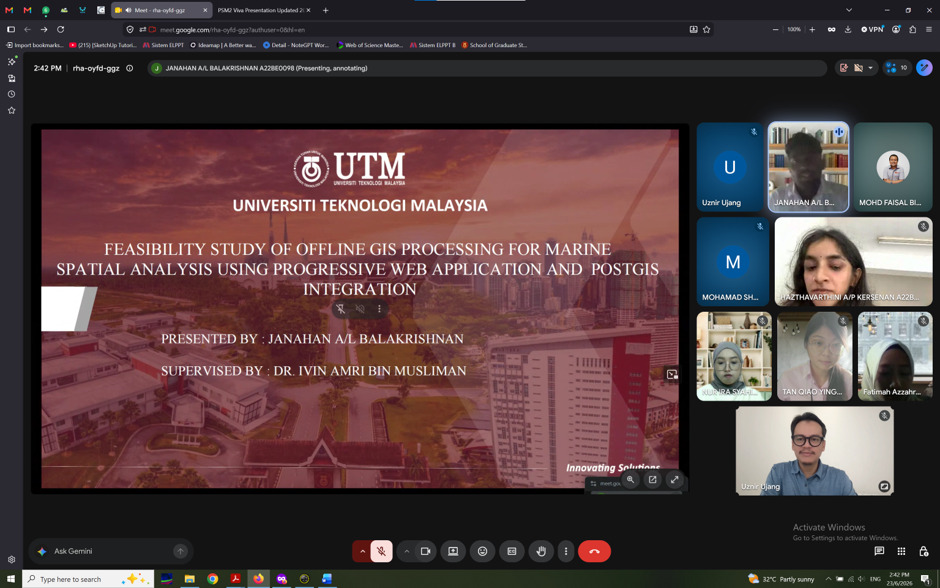
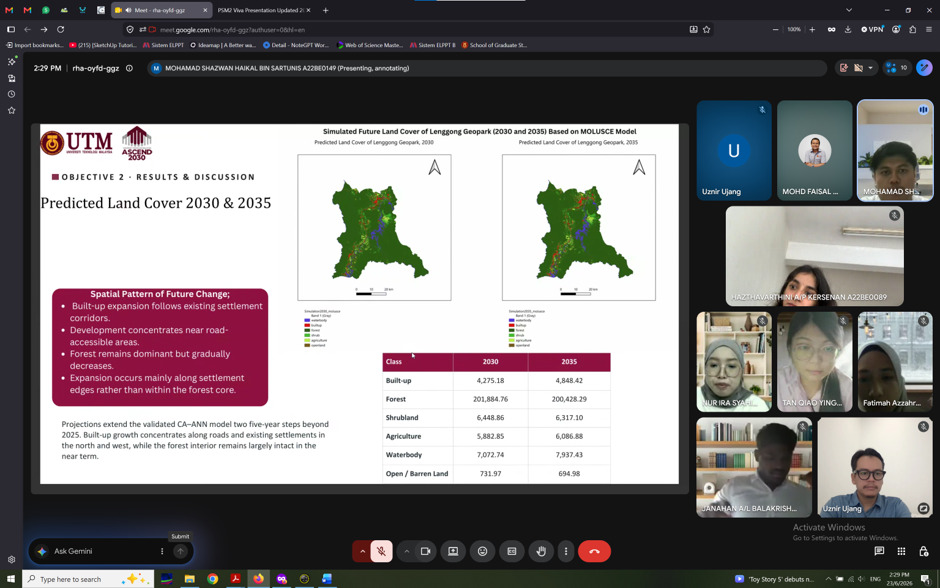
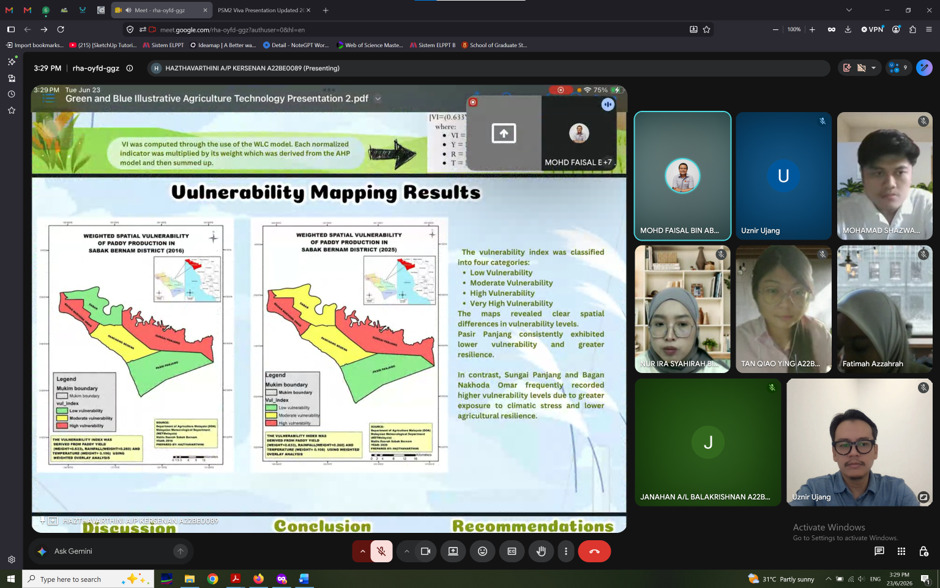
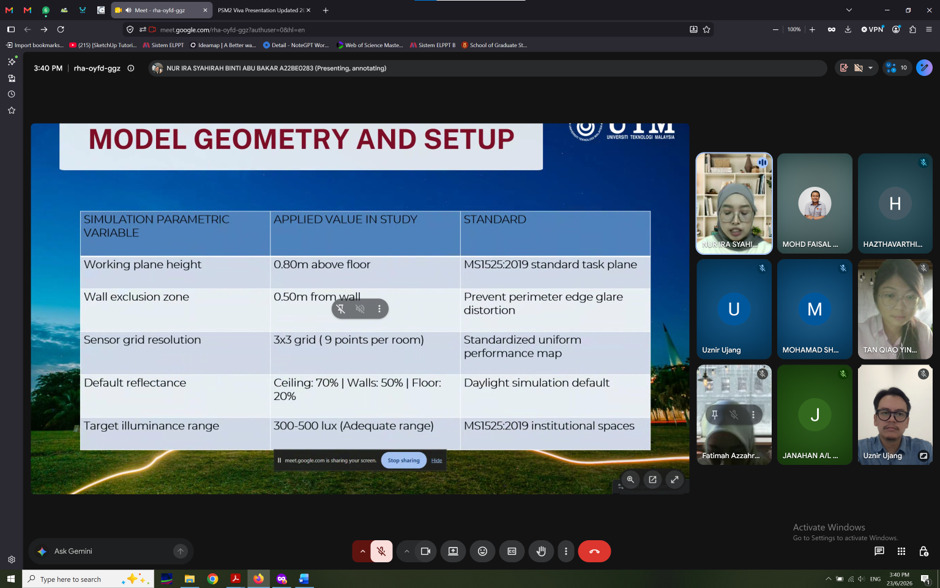
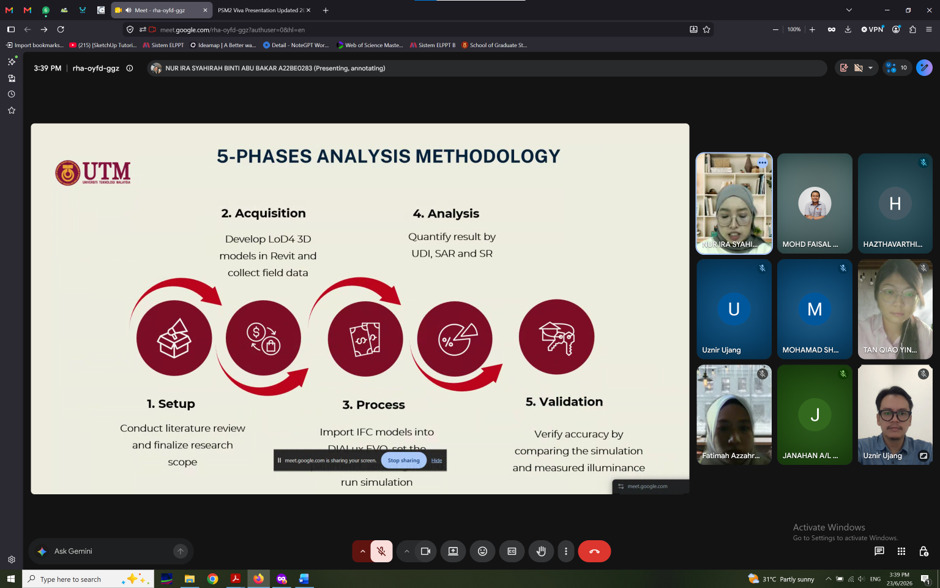
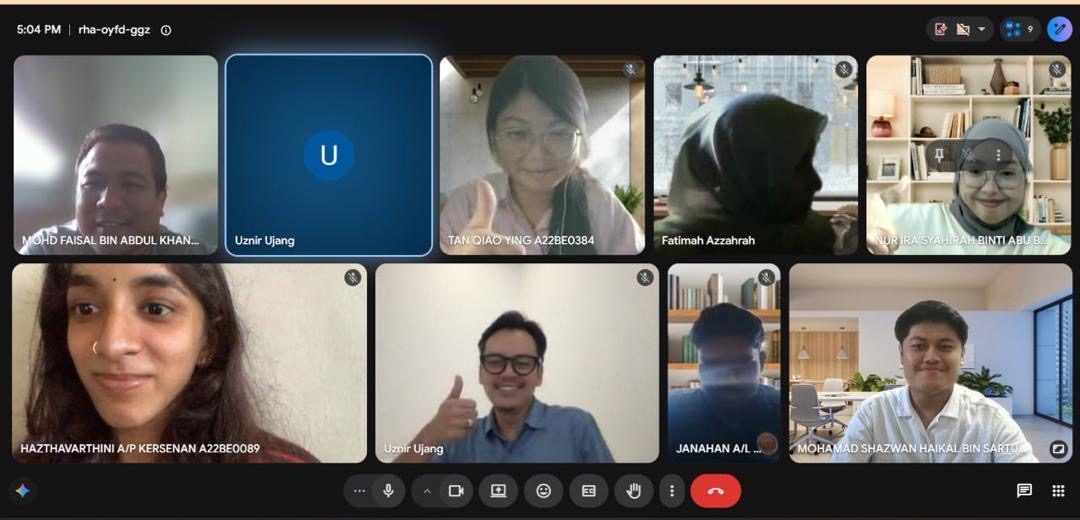
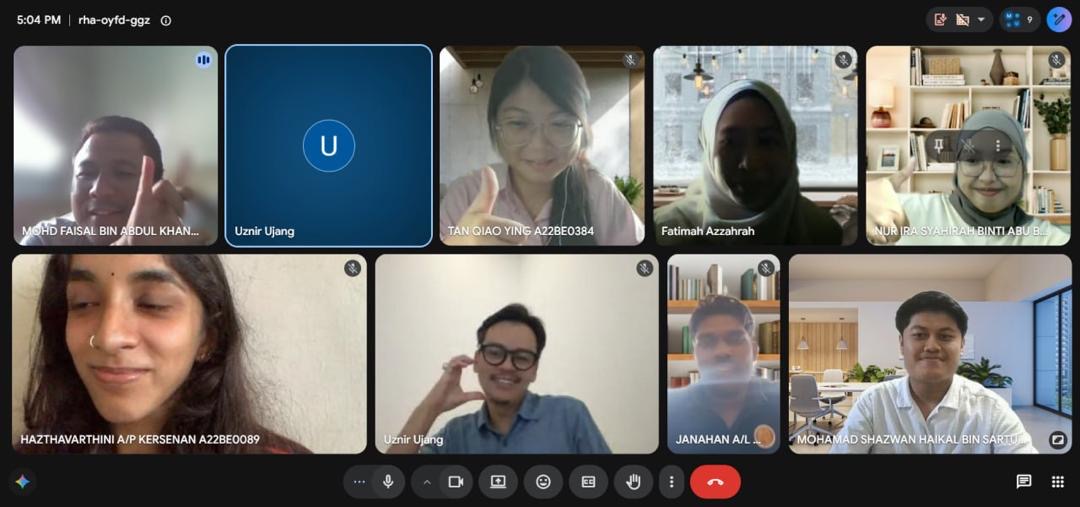
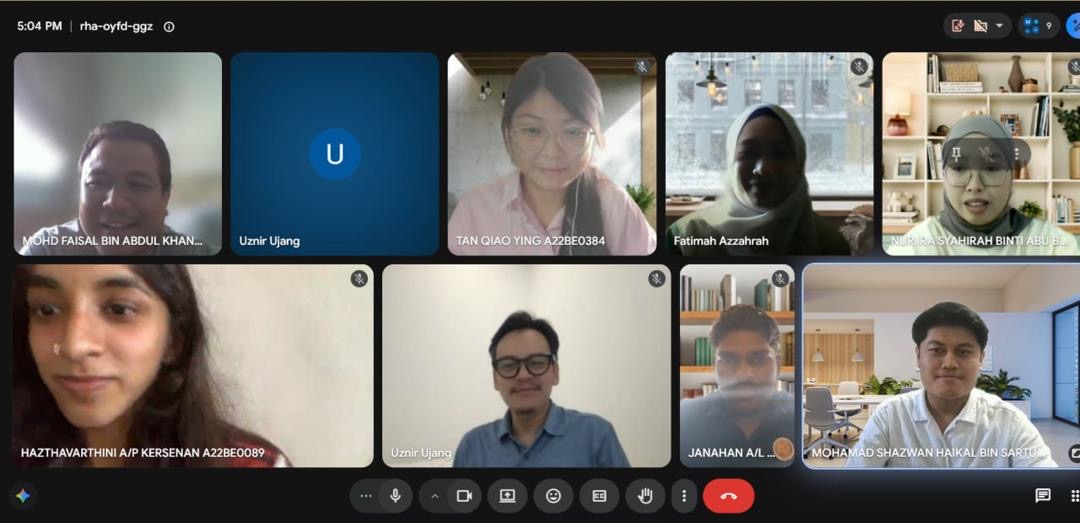
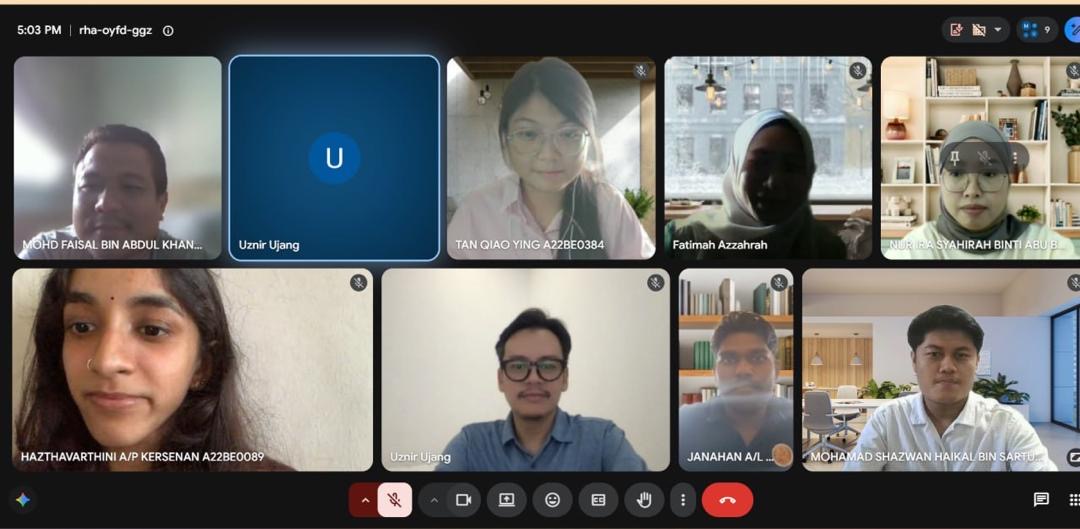
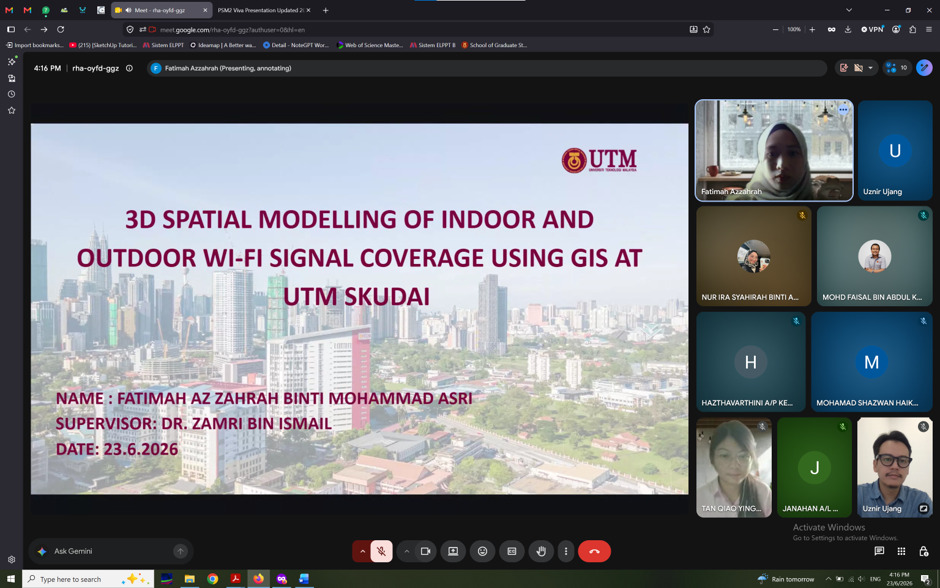
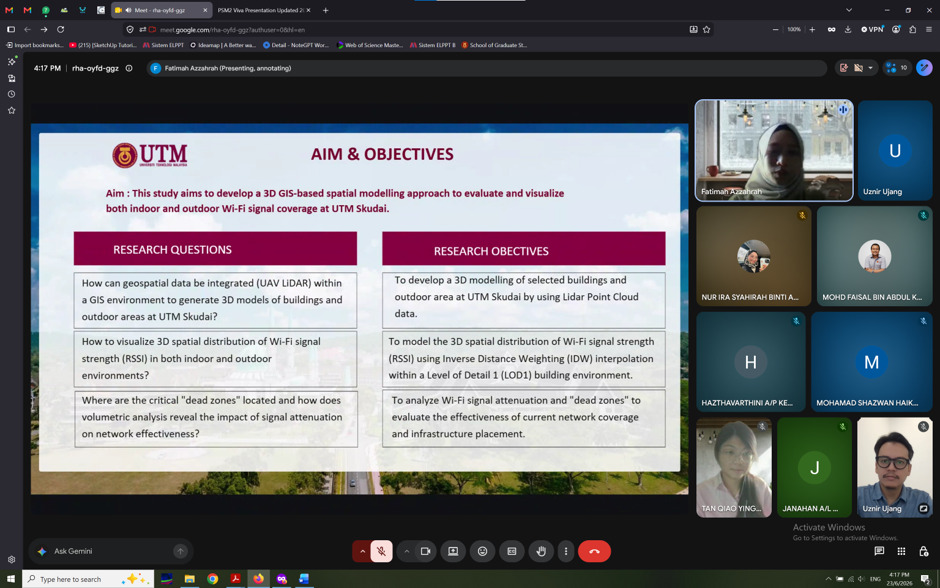
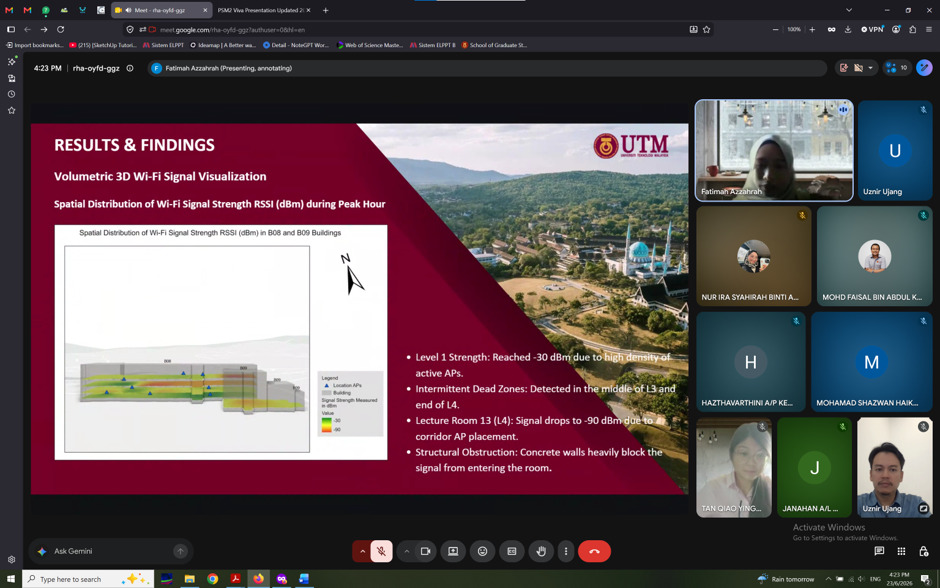
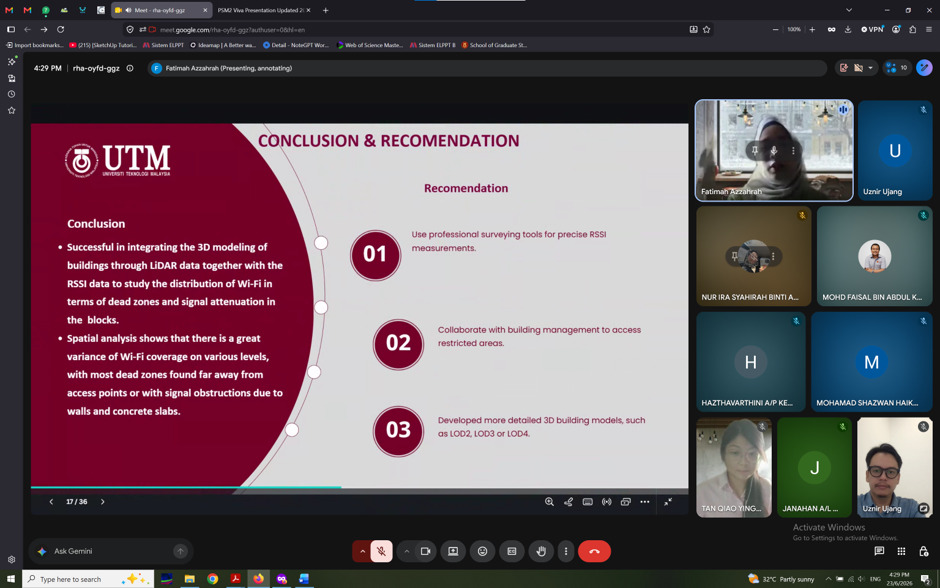
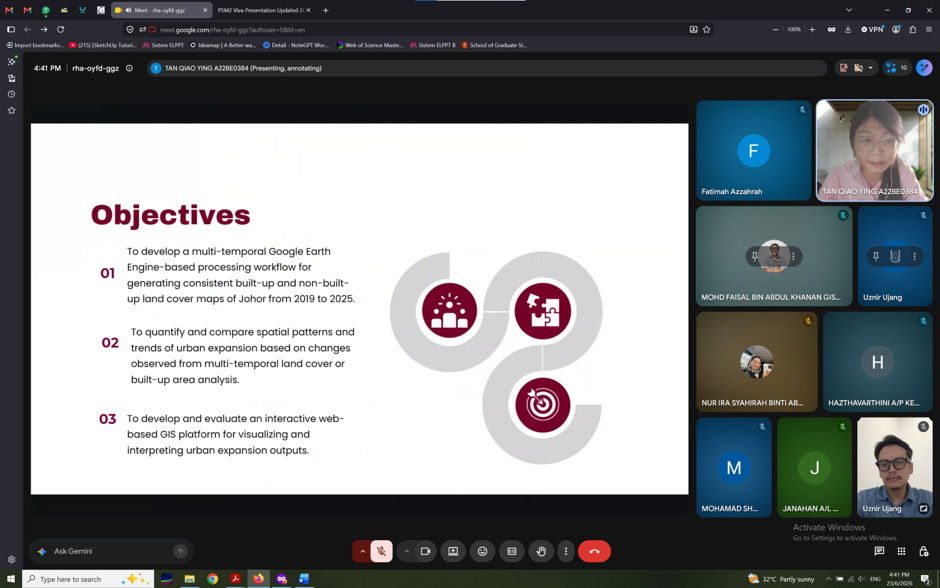
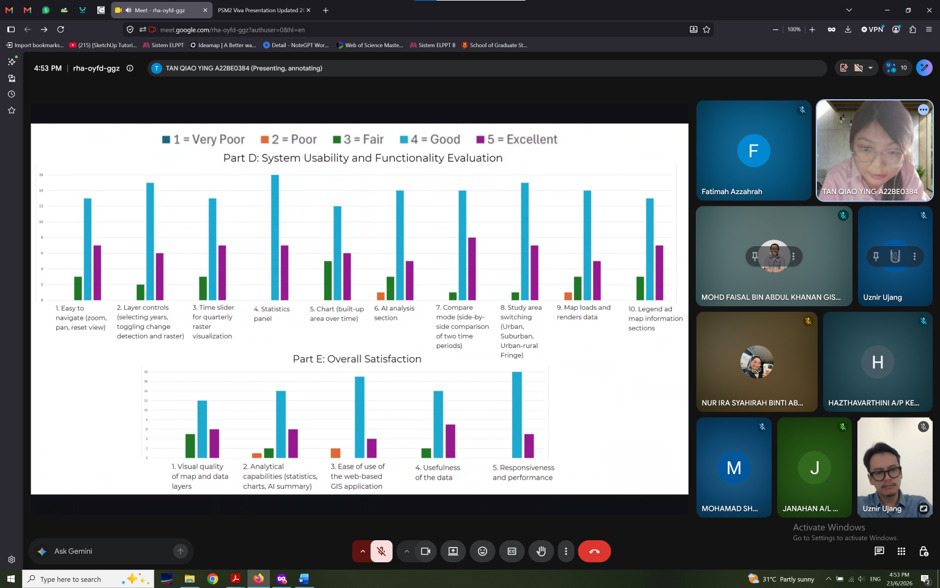
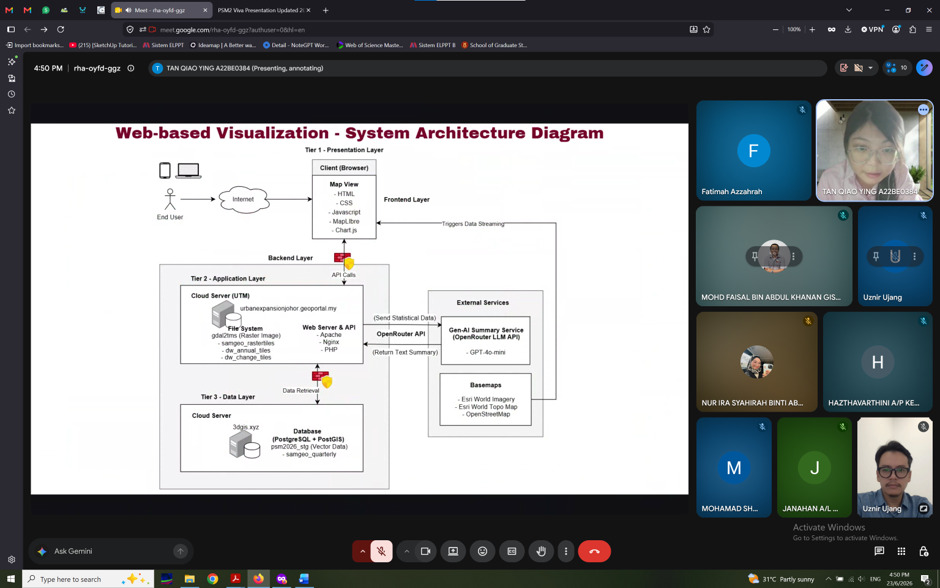
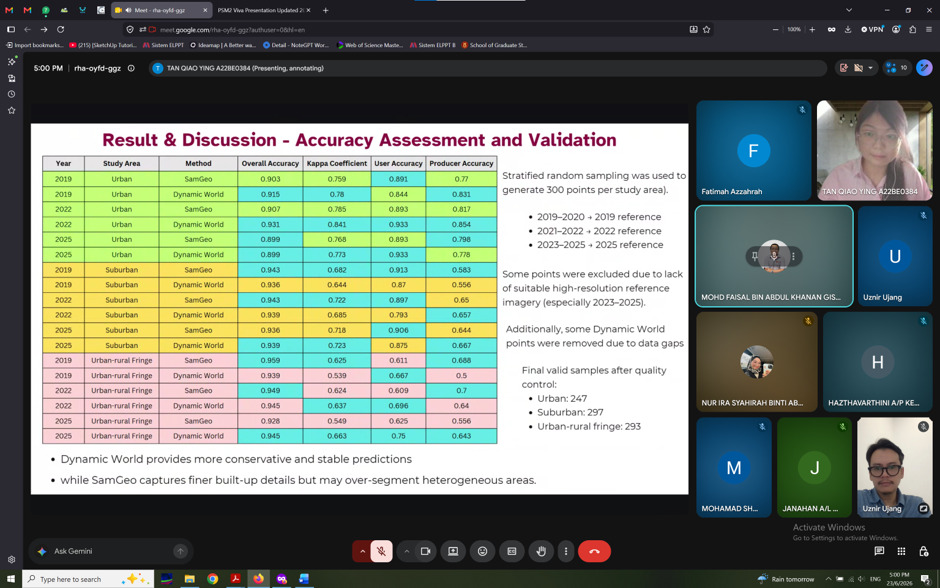
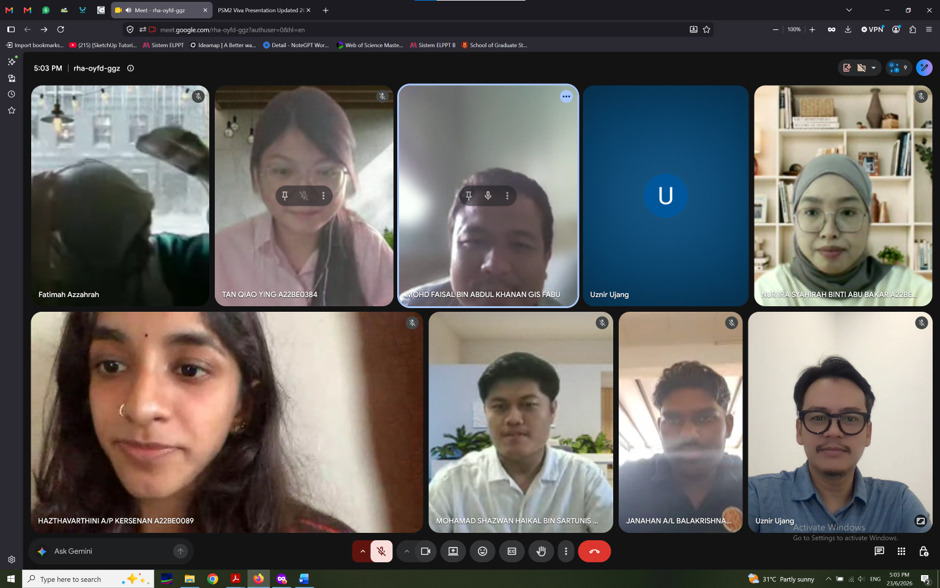
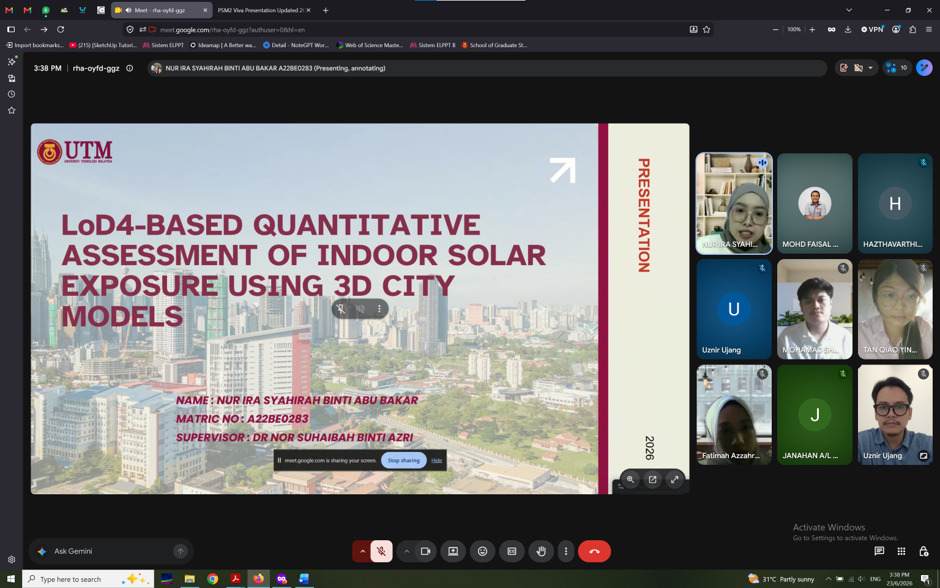
This afternoon, I had the opportunity to serve as a panel examiner for the PSM II (Final Year Project) presentations in the Geoinformation programme.

Throughout the afternoon, six final-year students presented their research:

• Mohamad Shazwan Haikal bin Sartunis – Assessing land cover change dynamics and future land cover prediction in Lenggong Geopark using GIS analysis.

• Janahan A/L Balakrishnan – Feasibility study of offline GIS processing for marine spatial analysis using Progressive Web Application and PostGIS integration.

• Hazthavarthini A/P Kersenan – Spatio-temporal analysis of paddy yield vulnerability to short-term weather variability in Sekinchan, Selangor using GIS.

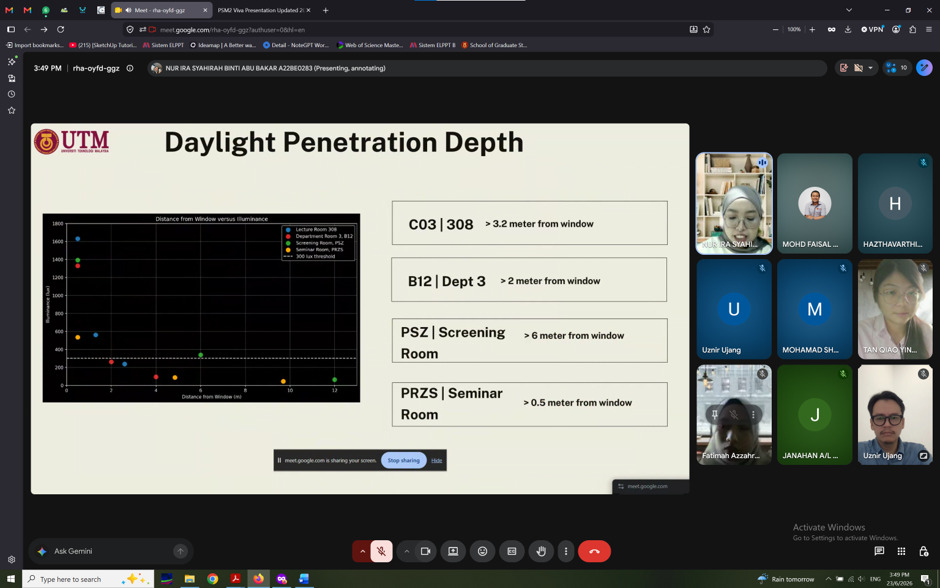
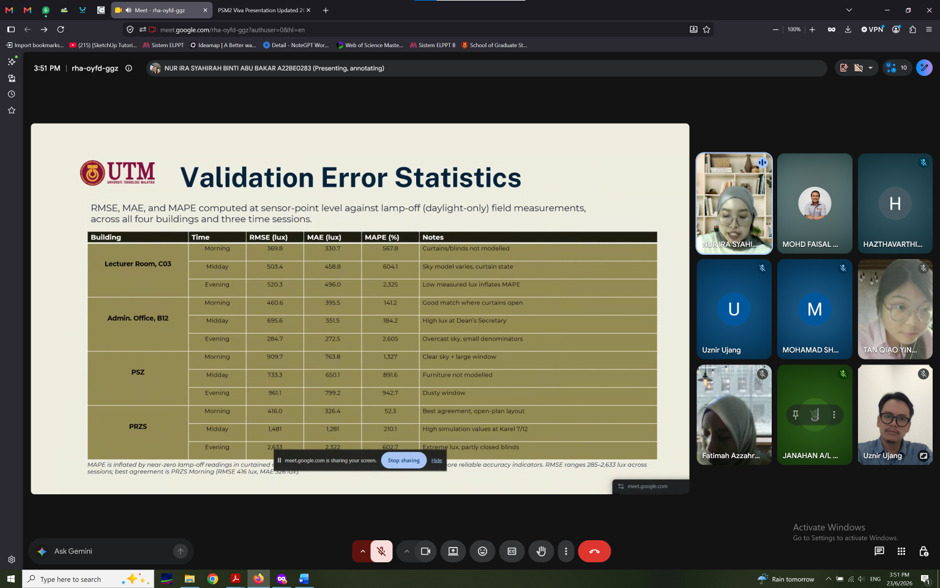
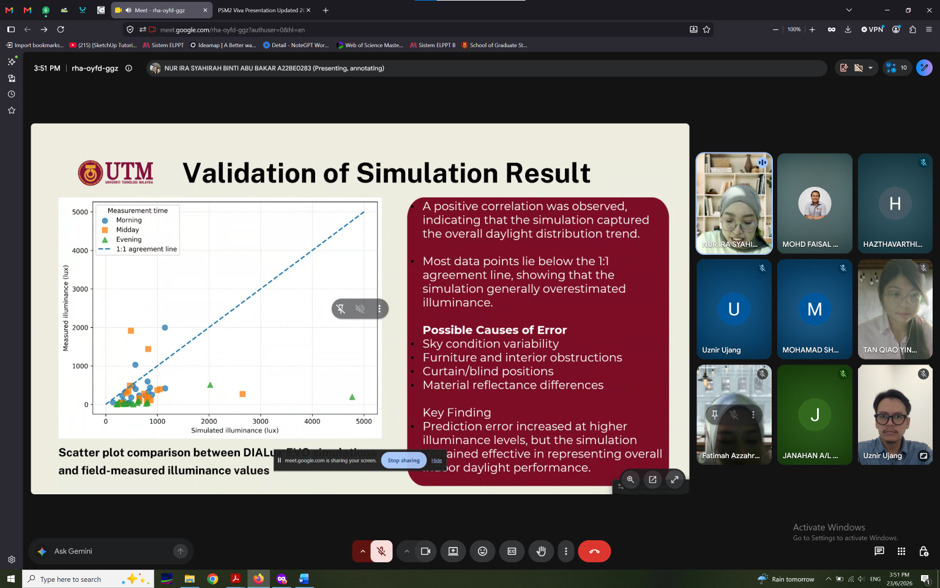
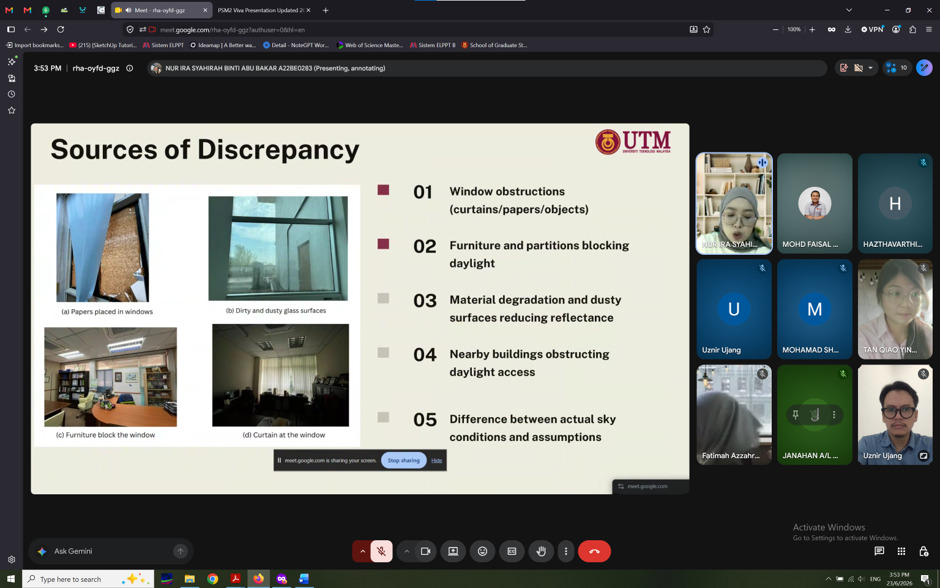
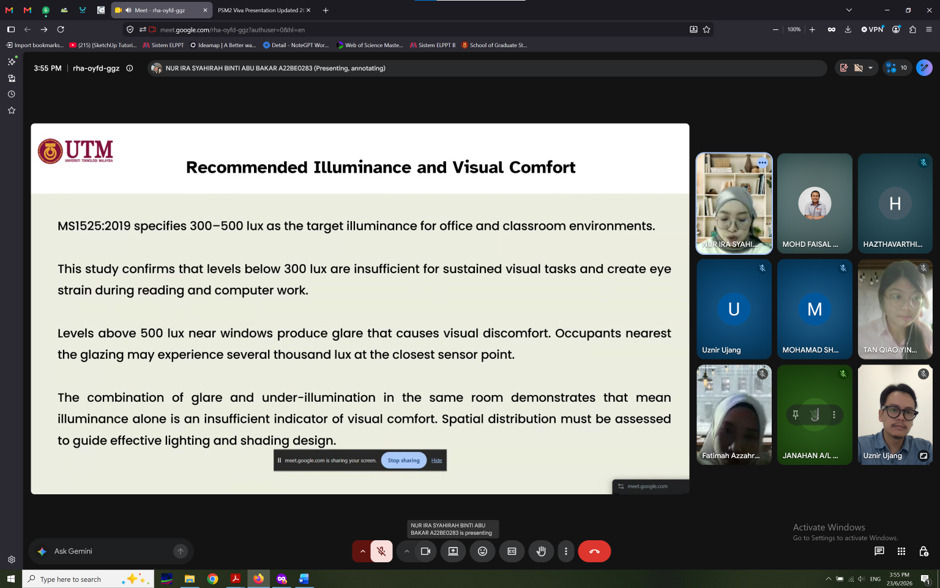
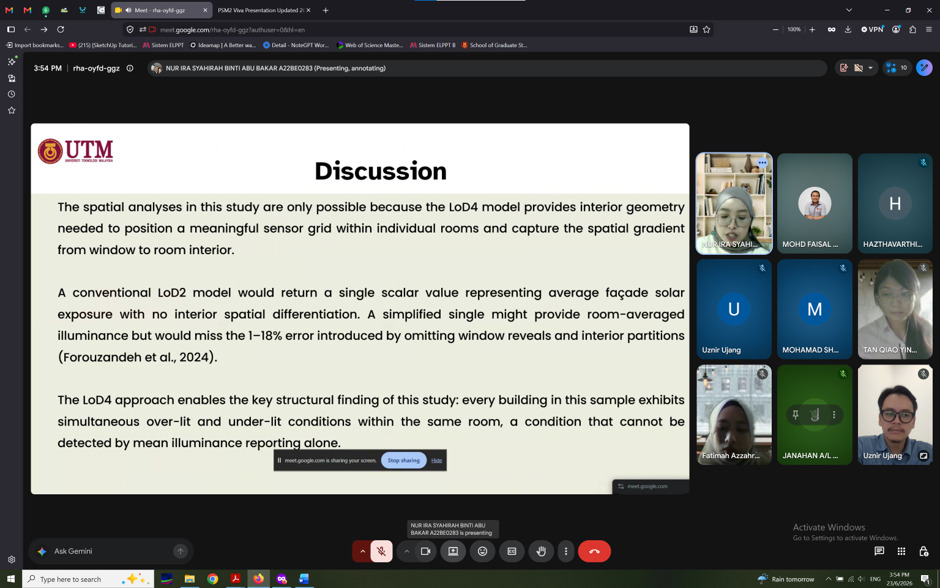
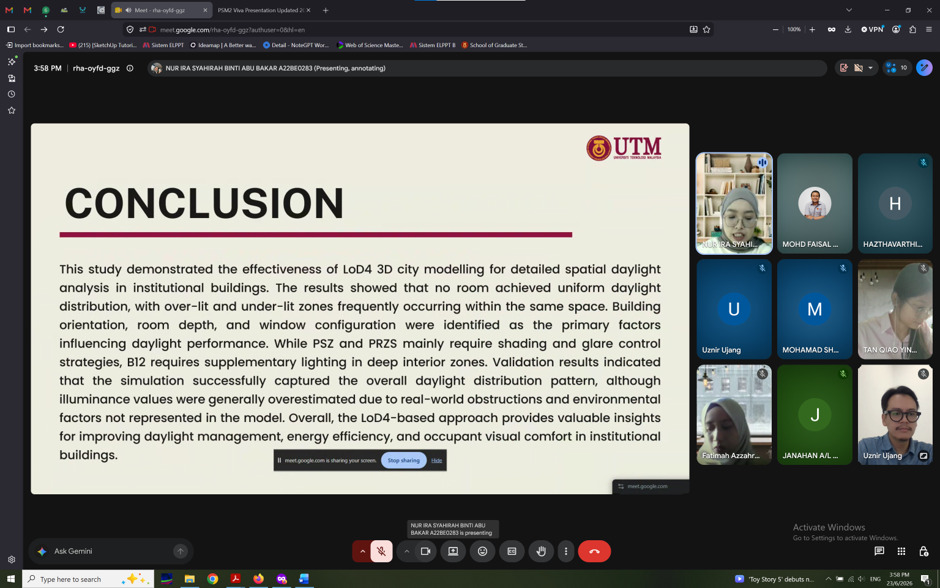
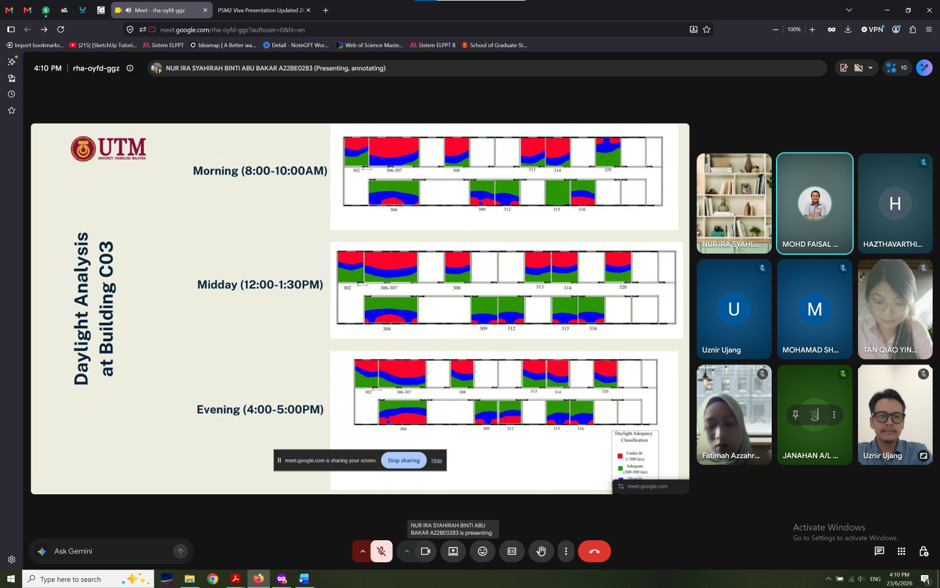
• Nur Ira Syahirah binti Abu Bakar – LOD4-based quantitative assessment of indoor solar exposure using 3D city models.

• Fatimah Az Zahrah binti Mohammad Asri – Analysis of Wi-Fi signal distribution and quality at UTM campus using GIS.

• Tan Qiao Ying – Assessment of urban expansion patterns in Perak using Google Earth Engine and web-based visualisation.

It is always encouraging to see undergraduate students applying advanced geospatial technologies such as GIS, 3D city modelling, Google Earth Engine, web GIS, PostGIS, and spatio-temporal analysis to solve real-world challenges. The diversity of topics also reflects how broad and impactful the geospatial field has become, covering environmental monitoring, agriculture, urban planning, smart cities, energy analysis, and wireless communication.

The presentations went smoothly, and I was impressed by the effort, preparation, and confidence shown by every student. Beyond evaluating their work, sessions like these are valuable opportunities to exchange ideas, provide constructive feedback, and help students strengthen their research before graduation.

Congratulations to all six students for reaching this important milestone. I wish each of you all the very best in completing your final projects and in your future careers.

My sincere appreciation also goes to all the supervisors for their continuous guidance and dedication in nurturing the next generation of geospatial professionals.

#GIS #GeospatialScience #FinalYearProject #PSMII #UTM #3DGIS