Lessons Learned from Failed GIS Systems: The Importance of Planning, Testing, and User Engagement

Failed GIS systems can fail for a variety of reasons, such as poor planning and design, lack of user input and involvement, inadequate testing and quality control, lack of training and support for users, and a lack of resources or funding to maintain and update the system.

One example of a failed GIS system is the Denver International Airport’s baggage handling system. The system, which was based on GIS technology, was intended to automatically route and track baggage throughout the airport, but it failed to function properly upon its launch in 1995. The system was plagued by technical problems, software bugs, and poor design, and ultimately had to be replaced at a cost of over $200 million.

One example of a failed GIS system is the New Orleans Geographic Information System (NOGIS) project, which was intended to provide detailed information about the city’s infrastructure and demographics to aid in emergency management and disaster response. The project, which was launched in the early 2000s, was plagued by issues such as poor data quality, lack of user buy-in, and a lack of funding. Despite significant investments in the project, it ultimately failed to meet its goals and was eventually abandoned.

Another example of a failed GIS system is the UK’s National Health Service’s (NHS) National Programme for IT (NPfIT). This project aimed to provide a centralized electronic health record system for all NHS patients, but faced a number of challenges such as lack of buy-in from medical staff, technical difficulties, and cost overruns. The project was eventually scaled back and many of its goals were never achieved.

Another example of a failed GIS system is the London Congestion Charge, a system implemented in 2003 to charge drivers for entering a designated congestion zone in the city. The system, which relied on cameras and license plate recognition technology, was plagued by technical issues and inaccurate billing, resulting in significant public backlash and a loss of revenue for the city.

One example of a failed GIS system is the launch of the UK’s National Land and Property Gazetteer (NLPG) in 2003. The NLPG was intended to provide a comprehensive, accurate and up-to-date database of all land and property in the UK, but the project was plagued by delays and technical issues. Despite an initial budget of £13 million, the project ended up costing over £50 million and was eventually abandoned in 2010. The failure of the NLPG was attributed to a lack of proper planning, inadequate testing, and poor management.

Another example of a failed GIS system is the implementation of the Computer-Assisted Mass Appraisal (CAMA) system in Cook County, Illinois, USA. The CAMA system was intended to improve the efficiency of the county’s property tax assessment process, but the system was plagued by inaccuracies and inconsistencies, leading to widespread complaints from property owners. The system was eventually abandoned in 2010 and replaced with a new system. The failure of the CAMA system was attributed to poor data quality, lack of proper testing, and inadequate training for users.

In Malaysia, one example of a failed GIS system is the implementation of the Integrated Management System for Land Administration (IMS-LA) by the National Land Management Department (NLMD). The system was intended to improve the efficiency and transparency of land administration in Malaysia, but it was plagued by technical issues and data inaccuracies. The system was eventually abandoned in 2016 and replaced with a new system. The failure of the IMS-LA system was attributed to a lack of proper planning, inadequate testing, and poor management.

Another example of a failed GIS system in Malaysia is the National Land Information System (NLIS) project. The project, which was intended to create a centralized database of land information for the country, was plagued by delays, cost overruns, and technical issues, and ultimately had to be cancelled in 2013. [to confirm]

These examples highlight the crucial role that proper planning, design, testing, and maintenance play in the development and implementation of GIS systems in order to avoid failure. Factors such as poor data quality, lack of user engagement, insufficient funding, technical difficulties, and lack of coordination among stakeholders can all contribute to the failure of a GIS system. To ensure success, it is important for GIS systems to be carefully planned, user-centered, and regularly monitored and evaluated. It is worth noting that these failures were not necessarily caused by GIS technology itself, but by poor management, unrealistic expectations, and lack of proper planning, implementation and testing. It is important to remember that all systems, regardless of how well-designed, can encounter unforeseen issues or fail to meet user needs. Therefore, it is the responsibility of the system analyst to anticipate and address potential risks, and to continuously monitor and evaluate the system to ensure its ongoing effectiveness and success.

Exploring the Subfields of Geoinformation

Some other thought:

  • “Geoinformation” is the overarching term that encompasses all the fields related to the collection, management, analysis, and dissemination of geographic information.

  • Under “Geoinformation”, we have several subfields:

    • Geographic Information Systems (GIS): A system for capturing, storing, analyzing, and displaying geographically referenced information.
    • GIScience (also known as geospatial science or geoinformatics): The scientific study of the principles and methods used in GIS, including geographic concepts, data structures, algorithms, and software used in GIS, as well as the social and ethical implications of GIS technology.
    • Geomatics: The field of study that deals with the measurement, representation, analysis, and management of spatial data, including a wide range of technologies and techniques such as remote sensing, surveying, and cartography.
      • Land Information System (LIS): A subfield of geomatics that focuses on the collection, management, and analysis of land-related data, often involving the use of GIS and other geomatics technologies.
    • Geoinformatics: The field that combines elements of GIS, computer science, and statistics to create new ways of understanding and managing spatial data.
    • Geoinformation Technology (also known as geospatial technology): The use of technology to acquire, process, analyze, and visualize geographic information, including a variety of technologies such as GIS, remote sensing, and GPS.

This network description shows how the term “Geoinformation” is the overarching term that encompasses all the other fields related to the study and application of geographic information, and these fields are more specific areas of focus within the field of geoinformation. Geomatics is a broad field that encompasses different subfields such as LIS that also use GIS and other geomatics technologies to understand and manage geographic information.

An Overview of Geographic Information Systems, GIScience, Geomatics, Geoinformatics, and Geoinformation Technology

Geographic Information System (GIS) is a system for capturing, storing, analyzing, and displaying geographically referenced information. This can include data such as maps, satellite imagery, and demographic information. GIS allows users to create, edit, and analyze spatial data and create visual representations such as maps and 3D models.

GIScience (also known as geospatial science or geoinformatics) is the scientific study of the principles and methods used in GIS. It encompasses the study of geographic concepts, data structures, algorithms, and software used in GIS, as well as the social and ethical implications of GIS technology.

Geomatics is the field of study that deals with the measurement, representation, analysis, and management of spatial data. It encompasses a wide range of technologies and techniques, including GIS, remote sensing, surveying, and cartography.

Geoinformatics is the use of information science and technology to acquire, process, analyze, and visualize geographic information. It combines elements of GIS, computer science, and statistics to create new ways of understanding and managing spatial data.

Geoinformation Technology (also known as geospatial technology) is the use of technology to acquire, process, analyze, and visualize geographic information. It encompasses a variety of technologies such as GIS, remote sensing, and GPS, and is used in a wide range of applications including land use planning, natural resource management, environmental monitoring, transportation, and emergency response.

In summary, all these terms are related to the field of geography and the study of geographic information, but they all have slightly different focus areas. GIS is a system for capturing, storing, analyzing, and displaying geographically referenced information. GIScience is the scientific study of the principles and methods used in GIS. Geomatics is the field of study that deals with the measurement, representation, analysis, and management of spatial data. Geoinformatics is the use of information science and technology to acquire, process, analyze, and visualize geographic information. Geoinformation Technology (geospatial technology) is the use of technology to acquire, process, analyze, and visualize geographic information in various applications.

Open Data Geospatial

Open data geospatial refers to geospatial data that is freely available for anyone to access, use, and share without any legal or financial restrictions. This can include data such as satellite imagery, digital elevation models, land cover maps, and other types of geospatial data.

Open data geospatial is becoming increasingly important as more organizations and individuals rely on geospatial data for a variety of applications. This includes fields such as environmental monitoring, urban planning, natural resource management, emergency response, transportation, and many others.

One of the main advantages of open data geospatial is that it can help to reduce the cost of geospatial data for organizations and individuals. It also allows users to access data that they may not have been able to afford otherwise.

Open data geospatial also promotes collaboration and sharing of knowledge among users and developers. The open nature of the data allows users to share their findings and modifications with the community, which can lead to the development of new features and capabilities.

Additionally, open data geospatial can help to promote transparency and accountability. Open data geospatial allows users to understand how the data was collected and processed, which can help to ensure that the data is accurate and reliable.

There are several organizations and initiatives that are leading the way in promoting open data geospatial. Some examples include:

  • OpenStreetMap: This is a community-driven project that aims to create a free and open map of the world. The data is crowdsourced from volunteers and is freely available for anyone to use and share.

  • Landsat: This is a program run by the US Geological Survey (USGS) that provides free satellite imagery of the earth. The data is collected by a series of satellites and is freely available for anyone to use.

  • Sentinel: This is a program run by the European Space Agency (ESA) that provides free satellite imagery of the earth. The data is collected by a series of satellites and is freely available for anyone to use.

  • Natural Earth: This is a public domain map dataset that provides detailed data on the physical and cultural features of the earth. The data is freely available for anyone to use and share.

  • Open Data Cube: This is an open-source platform that allows users to access, process, and analyze large amounts of satellite imagery. The platform is designed to make it easy to access and work with satellite data and is available for anyone to use.

  • OpenAerialMap: An open-source platform that allows users to access and share Aerial imagery, it is a community-driven project that aims to provide free and open data for mapping and research.

  • Global Land Cover Facility (GLCF) at the University of Maryland, USA: GLCF provides a wide range of remotely-sensed land cover data sets, including satellite imagery, digital elevation models, and land cover maps, which are freely available for anyone to use and share.

  • OpenTopography at San Diego State University, USA: OpenTopography provides free and open access to high-resolution topography data, tools and services, including digital elevation models (DEMs), lidar data, and other geospatial data sets.

  • OpenAddresses: A global initiative that aims to collect, clean, and publish all addresses data as open data, providing access to a comprehensive and up-to-date database of addresses worldwide, which can be used for geocoding and other spatial analysis.

  • OpenClimateGIS: A collaborative project that aims to provide access to a comprehensive set of geospatial data, tools, and services for studying the Earth’s climate.

  • Open GeoHub: A collaborative platform that provides access to a wide range of geospatial data, tools, and services, including satellite imagery, digital elevation models, and land cover maps.

  • GeoNode: An open-source platform for managing and sharing geospatial data and maps, it allows users to upload, publish, and share geospatial data in a variety of formats. It also provides tools for data management, spatial analysis, and map visualization.

  • OpenClimateData: An open-source initiative that aims to provide access to a wide range of climate data, including temperature, precipitation, and other climate-related data.

  • Open Data Kit (ODK): An open-source platform that enables users to collect, manage and share data using mobile devices. It is widely used for data collection and management in fields such as health, agriculture, and environmental monitoring.

  • OpenEarth: An open-source platform that provides access to a wide range of geospatial data, tools, and services, with a focus on coastal and marine data.

  • OpenElevation: A free and open-source API that provides access to a global database of elevation data, it allows users to retrieve elevation data for any location on earth.

These are just a few more examples of organizations and initiatives that are promoting open data geospatial. The field is constantly evolving and more organizations and initiatives are joining the effort to provide free, open, and accessible geospatial data for everyone to use.

Another example of organizations that promote open data geospatial is the Open Geospatial Consortium (OGC) which is an international organization that promotes the use of open standards for geospatial data and services. The organization develops and maintains a number of open standards for geospatial data, such as the Web Map Service (WMS) and the Web Feature Service (WFS), which are widely used for sharing and accessing geospatial data over the internet.

Additionally, there are a number of government organizations that promote open data geospatial. For example, the United States Geological Survey (USGS) and the National Aeronautics and Space Administration (NASA) provide access to a wide range of geospatial data, including satellite imagery and digital elevation models. Similarly, the European Union’s Copernicus programme and the European Space Agency (ESA) provide access to a wide range of geospatial data and services, including satellite imagery and land cover maps.

Lastly, there are also non-profit organizations that promote open data geospatial, such as the Humanitarian OpenStreetMap Team (HOT) which uses OpenStreetMap to map areas affected by natural disasters and other crises, to support disaster response and recovery efforts.

There are many organizations and initiatives that promote open data geospatial, from international organizations, government organizations, and non-profit organizations. These organizations and initiatives play a critical role in making geospatial data accessible and available to a wide range of users, including individuals, organizations, and governments. They provide access to a wide range of geospatial data, tools, and services, and promote the use of open standards and open data practices. By promoting open data geospatial, these organizations and initiatives are helping to drive innovation and collaboration in the field of geospatial technology, and support the advancement of knowledge and understanding of the earth and its resources.

In conclusion, open data geospatial is a critical resource for individuals, organizations, and governments to access, process and analyze geospatial data. This data is freely available for anyone to use, share, and modify without any legal or financial restrictions. Open data geospatial can help reduce the cost of geospatial data and promote collaboration, sharing of knowledge, transparency, and innovation in geospatial software development. There are many organizations and initiatives that promote open data geospatial, including OpenStreetMap, Landsat, Sentinel, Natural Earth, Open Data Cube, OpenAerialMap, OpenTopography, OpenAddresses, OpenClimateGIS, Open GeoHub, GeoNode, OpenClimateData, Open Data Kit, OpenEarth, OpenElevation, Open Geospatial Consortium, government organizations and non-profit organizations. These organizations and initiatives are helping to make geospatial data accessible and available to a wide range of users, and support the advancement of knowledge and understanding of the earth and its resources.

Saving GIS Data to Another File Format using Python

Once you have read the data from a GIS file using Fiona, you can save it to another file format using the fiona.open() method and the ‘w’ mode. You can also use the fiona.open() method to save the data to a new file, by specifying the file path and format, and passing the ‘w’ mode as the second argument.

Here is an example of how to save the data from a shapefile to a geojson file:

In this example, the data is read from a shapefile and written to a geojson file. The properties, crs, and schema of the new file are defined from the source file using the src.schema and src.crs attributes.

It’s important to note that when saving the data to a new file, the file format and the driver must be specified correctly, and the schema and properties must match the data being written. You can also use the same approach to save the data to other file formats such as KML, CSV, or any other format supported by Fiona. You just need to change the driver and the file path and extension accordingly.

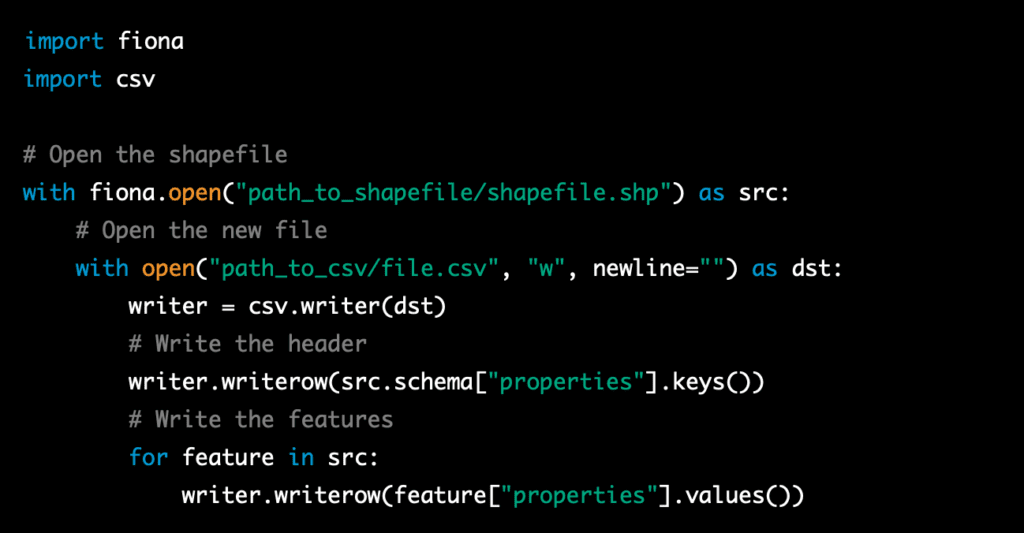
For example, to save the data to a CSV file:

This example uses the built-in csv library to write the data to a CSV file. It writes the header of the file using the keys of the properties from the source file and then it writes the values of the properties for each feature.

It’s worth noting that this is a basic example that can be extended and customized to suit the specific requirements of your project, and it’s recommended to consult the documentation of Fiona for more detailed information on how to use it and to have a deeper understanding of the functionality it offers.

Additionally, it’s important to thoroughly test your code and ensure that the data is being written correctly before deploying it.

How to Read Several Common GIS Data Types using Python

If you need to read several common GIS data types, such as shapefiles, geojson, KML, and others, in addition to the OGR library, you can use Fiona library. Fiona is a python library for reading and writing spatial data files. It is built on top of OGR and is designed to be more user-friendly and pythonic.

Fiona provides a simple, pythonic API to read and write spatial data files. It allows you to read and write data in several formats such as shapefiles, geojson, kml, and others. It is easy to use, you can open a file using Fiona and access the data just like a Python dictionary.

Here is an example of how to read a shapefile using Fiona:

This example shows how easy it is to read a shapefile using Fiona, you can open a file, iterate over the features and access the data, and close the file using the “with” statement.

Fiona also supports other formats such as geojson, KML, and others, you can use the same approach to read these other formats, by simply changing the file path and extension when opening the file with the fiona.open() method. For example, to read a geojson file, you would use:

Fiona also allows you to specify the driver when opening a file, in case the file format is not recognized by the library, this can be done by passing the driver name as a second argument to the fiona.open() method.

For example, to open a KML file, you would use:

Fiona also allows you to access the metadata of the file, such as the crs, schema, and properties, in a similar way as the features, it also allows you to write data to a file, in the same way you read it, you can simply iterate over the features and write them to a file.

It’s worth noting that fiona, as well as OGR, are powerful libraries that can handle a wide range of GIS data types and formats, it’s recommended to consult the Fiona documentation for more detailed information on how to use it and to have a deeper understanding of the functionality it offers.

Creating A “geopostcode” System

Creating a “geopostcode” system, also known as a “plus code” system, involves assigning unique codes to individual streets, buildings, or even specific units within a building. The process of creating such a system can be complex and would involve several steps. Below is an example of the pseudocode for creating a “geopostcode” system:

  1. Start by gathering data on all addresses and locations in the area to be covered by the “geopostcode” system. This data should include information on street names, building numbers, and other relevant details.

  2. Use this data to create a digital map of the area, with each address and location represented by a unique point on the map.

  3. Divide the area into smaller sections, such as neighborhoods or blocks. Assign a unique code to each section, based on its location on the map.

  4. Within each section, assign a unique code to each street, building, or unit. This can be done by using a combination of the section code and a unique identifier for the street, building, or unit.

  5. Test the “geopostcode” system by using it to locate specific addresses and ensure that the codes are accurately identifying the correct locations.

  6. Implement the “geopostcode” system, and update it as necessary to reflect any changes in the area.

It’s worth noting that this is just an example of the pseudocode, and the actual implementation of a “geopostcode” system would involve more complexity, additional steps and a high level of accuracy to ensure the codes are accurate and reliable.

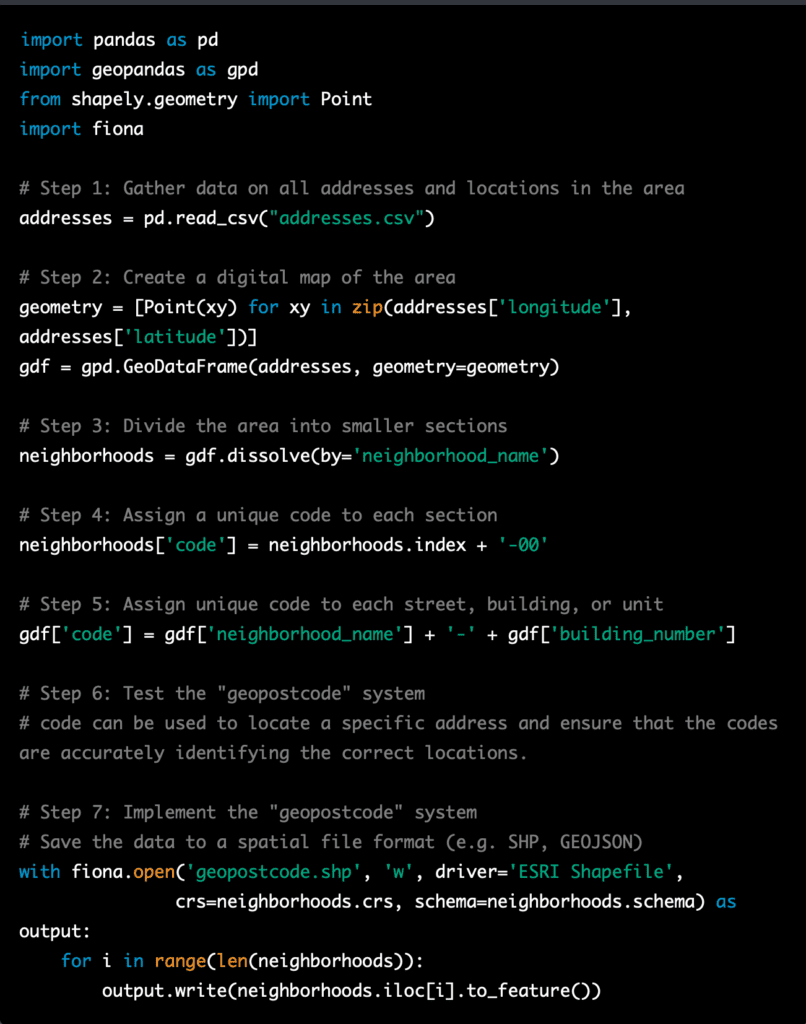
Converting the pseudocode for creating a “geopostcode” system into actual code would depend on the programming language and tools being used. Below is an example of how the pseudocode could be implemented in Python, using the Pandas and Geopandas library for data manipulation, and Fiona for reading/writing spatial data:

This is just an example of how the pseudocode for creating a “geopostcode” system could be implemented in Python. The actual implementation would depend on the specific requirements and constraints of the project, and would likely involve additional steps and a high level of accuracy to ensure that the codes are accurate and reliable.

It’s important to note that creating a “geopostcode” system is a complex task and it should be done by experts in GIS and data management. Additionally, it’s important to consider the legal aspects and regulations of the country where the system will be implemented.

Procedures to Create Geopostcodes

Creating a geocode or geopostcode involves several steps, including:

  1. Collecting location data: The first step in creating a geocode is to collect location data, such as addresses, postal codes, or place names. This data can be collected from a variety of sources, such as government databases, online directories, or GPS devices.

  2. Standardizing and cleaning the data: The collected data must be cleaned and standardized to ensure that it is accurate and consistent. This may involve correcting errors in the data, such as misspellings, and formatting the data in a consistent way.

  3. Matching the data to geographic coordinates: Once the data is cleaned and standardized, it must be matched to its corresponding geographic coordinates, such as latitude and longitude. This process is known as geocoding, and it can be done using a variety of methods, such as using a web-based geocoding service, or by using a software tool or programming library.

  4. Storing and updating the data: The geocoded data must be stored in a database or other data repository, and it should be updated regularly to ensure that it remains accurate.

  5. Making the data available: The geocoded data can be made available to users through a variety of means, such as through a web-based mapping application, an API, or a data download.

It’s worth noting that, creating a geocode or geopostcode can be a complex process and it requires a significant investment in time, resources, and expertise. Additionally, the quality and accuracy of the geocoding results can vary depending on the data sources and algorithms used.

Applications of Geopostcode in the United Kingdom

Here are a few examples of real-world applications where geocoding with postcodes is used in the United Kingdom:

  1. Mapping and navigation: The UK’s Ordnance Survey provides a mapping service called OS Maps, which allows users to view and print maps of the UK using postcodes. This service is used by hikers, cyclists, and other outdoor enthusiasts to plan routes and to find locations.

  2. Retail and marketing: Royal Mail’s postcode data is used by businesses to identify areas with high concentrations of potential customers and to target their marketing campaigns. For example, a car dealership might use postcode data to identify areas with a high density of households with high incomes, and target its advertising for luxury cars to those areas.

  3. Logistics and delivery: Royal Mail’s postcode data is used by companies such as DHL and UPS to sort and deliver mail and packages. They use postcodes to identify the location of an address and to optimize the routes of their delivery vehicles.

  4. Public services: The UK’s National Health Service (NHS) uses geocoding with postcodes to plan and deliver healthcare services. For example, it uses postcode data to identify areas with high concentrations of elderly people and to plan services such as geriatric care.

  5. Real estate and property management: Real estate professionals and property managers use geocoding with postcodes to identify and map properties, as well as to determine the value of a property. They might use postcode data to identify properties that are in high-demand areas or that are at risk of flooding or other hazards.

  6. Public transport: Transport for London (TFL) uses geocoding with postcodes to plan and operate public transport services, such as bus and rail. They use postcodes to identify the location of stops, stations, and depots, and to optimize routes and schedules.

These are just a few examples of how geocoding with postcodes is being used in the UK to improve decision-making and operational efficiency in various fields and industries.

Geocoding in The United Kingdom

In the United Kingdom, geocoding is commonly referred to as “geopostcode” and is used for a variety of applications, such as mapping, marketing, and logistics.

The Royal Mail, which is the UK’s postal service, assigns a unique postal code, known as a “postcode” to every address in the country. These postcodes are used by the Royal Mail to sort and deliver mail, but they are also widely used in other applications as a way of identifying and locating specific addresses.

The Royal Mail provides a Postcode Address File (PAF) that contains the postcode and location data for every address in the UK. This data can be used for geocoding, and it is widely used by businesses, government agencies, and other organizations to match addresses to their corresponding geographic coordinates.

The Royal Mail also provides an online geocoding service, known as “Code-Point Open,” that allows users to match postcodes to their corresponding geographic coordinates. This service is free to use, and it is widely used by businesses, researchers, and developers to geocode addresses and locations in the UK.

The Ordnance Survey, which is the UK’s national mapping agency, also provides a geocoding service, known as “Code-Point with Polygons,” that includes additional data such as the boundaries of administrative areas, such as local government districts, and the shape of postcode areas.

Overall, the use of postcodes as a form of geocoding is widely used and accepted in the UK, and it provides a consistent and accurate way of identifying and locating addresses in the country. The Royal Mail’s PAF and online geocoding services are widely used, and they provide a valuable resource for businesses, government agencies, and other organizations that need to geocode addresses and locations in the UK.

Here are a few examples of how geocoding with postcodes is used in the United Kingdom:

  1. Delivery and logistics: Companies such as Royal Mail, DHL, and UPS use geocoding with postcodes to sort and deliver mail and packages. They use postcodes to identify the location of an address and to optimize the routes of their delivery vehicles.

  2. Retail and marketing: Retailers such as Tesco and Sainsbury’s use geocoding with postcodes to identify areas with high concentrations of potential customers and to target their marketing campaigns. For example, they might use postcode data to identify areas with a high density of families with children, and target their advertising for baby products to those areas.

  3. Public services: Local government and emergency services use geocoding with postcodes to identify and respond to incidents more quickly and efficiently. For example, the police and fire department use postcodes to locate and respond to emergencies, and local government uses postcodes to plan and deliver public services.

  4. Real estate and property management: Real estate professionals and property managers use geocoding with postcodes to identify and map properties, as well as to determine the value of a property. They might use postcode data to identify properties that are in high-demand areas or that are at risk of flooding or other hazards.

  5. Public health: Public health professionals use geocoding with postcodes to map and track the spread of infectious diseases and to identify areas with high concentrations of health risks such as air pollution and poor access to healthcare.

  6. Transportation: Transportation companies use geocoding with postcodes to optimize routes, reduce transportation costs, and improve delivery times.

These are just a few examples of how geocoding with postcodes is used in the United Kingdom. Postcodes provide a consistent and accurate way of identifying and locating addresses in the country, and they are widely used in various applications to improve decision-making and operational efficiency.

Geocode, Geopostcode or Geocoding

A geocode, also known as a “geopostcode” or “geocoding” is a set of geographic coordinates, such as latitude and longitude, that corresponds to a specific location, such as a street address, city, or postal code. Geocoding is the process of converting a location description, such as an address or postal code, into a set of geographic coordinates that can be plotted on a map.

Geocoding is used in a variety of applications, such as mapping, transportation, and marketing. For example, geocoding can be used to display locations on a map, to determine the closest locations to a given point, to plan routes, and to target advertising to specific geographic areas.

There are several ways to geocode an address or postal code, such as using a web-based geocoding service, or by using a software tool or programming library. Some of the popular geocoding services are Google Maps, OpenStreetMap, Mapbox, ArcGIS, etc.

Geocoding services use a variety of data sources, such as street address databases, satellite imagery, and geographic information systems (GIS) data, to match an address or postal code to its corresponding geographic coordinates. The quality and accuracy of the geocoding results can vary depending on the data sources and algorithms used.

It’s important to note that geocoding can be a complex process and some addresses or postal codes may be difficult to geocode, such as rural or remote areas, or areas that have recently been developed. Additionally, errors or inaccuracies in the input data, such as misspellings, can also affect the geocoding results.

Overall, geocoding is a powerful tool for understanding and visualizing location-based data, and it can be used in a wide range of applications. However, it’s important to understand the limitations and potential inaccuracies of the process, especially when using it for important decisions.

Some examples of how geocoding is used in different applications include:

  1. Mapping and navigation: Geocoding is used to display locations on a map, such as points of interest, real estate listings, and weather forecasts. It can also be used to determine the closest locations to a given point and to plan routes. For example, ride-sharing apps like Uber and Lyft use geocoding to match riders with drivers, and to calculate the estimated time of arrival and fare.

  2. Retail and marketing: Geocoding is used to target advertising to specific geographic areas. Retailers and businesses can use geocoding to identify areas with high concentrations of potential customers, and to optimize their marketing campaigns. For example, a fast-food chain could use geocoding to identify areas with a high density of office buildings, and target its lunchtime advertising to those areas.

  3. Emergency services and logistics: Geocoding is used by emergency services, such as the police and fire department, to locate and respond to incidents more quickly and efficiently. Logistics companies use geocoding to optimize routes and reduce transportation costs.

  4. Public safety and security: Geocoding is used by government agencies to identify and respond to natural disasters, such as floods and hurricanes. It can also be used to identify and respond to security threats, such as crime hotspots and terrorist attacks.

  5. Urban planning and urban design: Geocoding is used by urban planners and urban designers to understand and visualize the relationships between different land uses, population density, and transportation patterns in a city. They use geocoding to analyze and map data such as population demographics, land use patterns, and transportation infrastructure, to inform the planning and design of new developments, transportation systems, and public spaces. This helps them to make informed decisions about where to locate new housing, commercial developments, and public facilities, and how to improve transportation and accessibility.

  1. Environmental monitoring and management: Geocoding is used by environmental scientists and managers to monitor and manage natural resources such as water, air, and biodiversity. For example, geocoding can be used to map and track the spread of invasive species, to monitor water quality and air pollution, and to identify and map wetlands, forests, and other ecosystems that are at risk of degradation.

  2. Real estate and property management: Geocoding is used by real estate professionals and property managers to identify and map properties, as well as to determine the value of a property. It can also be used to identify properties that are at risk of flooding, landslides, or other hazards.

  3. Public health: Geocoding is used by public health professionals to map and track the spread of infectious diseases, as well as to identify areas with high concentrations of health risks such as air pollution and poor access to healthcare.

These are just a few examples of how geocoding is used in different applications. It’s a powerful tool that can be used in a wide range of fields and industries, and it can help to improve decision-making and operational efficiency by providing a better understanding of geographic patterns and relationships.

Weather Forecasting – Part 2

To make accurate predictions, weather forecasters use a combination of observational data, numerical models, and their own expertise. They analyze data from weather stations, satellites, and radar to identify patterns and trends, and use their own knowledge of meteorology to make predictions.

Numerical weather prediction (NWP) is one of the most widely used methods for weather forecasting. NW it uses observational data to initialize the models and then uses the models to predict the future weather conditions. The models take into account factors such as temperature, pressure, wind, and precipitation, and use equations to simulate how these factors will change over time.

Statistical methods are also used to make predictions about future weather conditions. This method uses historical weather data to make predictions about future weather conditions. Statistical methods can be used to identify patterns in the data and make predictions based on those patterns. For example, a statistical model might be able to predict that a certain type of weather is more likely to occur during a specific time of year.

Remote sensing is also used to observe the weather conditions in real-time. This method uses satellite and radar imagery to observe the weather conditions in real-time. This information can be used to make short-term predictions about the weather, such as the location and intensity of a storm.

Hybrid methods, which use a combination of different methods, are also used to improve the accuracy of predictions. It uses the strengths of each method to compensate for the weaknesses of the others.

In summary, weather forecasting is a complex process that involves a combination of observational data, numerical models, and human expertise. Different methods have different strengths and weaknesses, and weather forecasters use a combination of methods to make accurate predictions. However, due to the complex nature of the atmosphere and the limitations of current forecasting methods, there will always be some degree of uncertainty when predicting the weather.

Weather Forecasting – Part 1

Weather forecasting is the process of predicting the weather conditions for a specific location and time in the future. There are several methods that can be used to predict the weather, including:

  1. Numerical weather prediction (NWP): This method uses mathematical models to simulate the behavior of the atmosphere. NW it uses observational data to initialize the models and then uses the models to predict the future weather conditions. The models take into account factors such as temperature, pressure, wind, and precipitation, and use equations to simulate how these factors will change over time.

  2. Statistical methods: This method uses historical weather data to make predictions about future weather conditions. Statistical methods can be used to identify patterns in the data and make predictions based on those patterns. For example, a statistical model might be able to predict that a certain type of weather is more likely to occur during a specific time of year.

  3. Remote sensing: This method uses satellite and radar imagery to observe the weather conditions in real-time. This information can be used to make short-term predictions about the weather, such as the location and intensity of a storm.

  4. Human Expertise: Weather forecasters use a combination of observational data, numerical models, and their own expertise to make predictions about the weather. Forecasters analyze data from weather stations, satellites, and radar to identify patterns and trends, and use their own knowledge of meteorology to make predictions.

  5. Hybrid methods: The combination of different methods to improve the accuracy of predictions. It uses the strengths of each method to compensate for the weaknesses of the others.

The accuracy of weather predictions is improving with time, however, it’s important to note that there will always be some degree of uncertainty when predicting the weather. Factors such as the complexity of the atmosphere, the quality of the observational data, and the limitations of the models used can all contribute to errors in the predictions.

In summary, Weather forecasting is the process of predicting the weather conditions for a specific location and time in the future. There are several methods that can be used to predict the weather, including numerical weather prediction (NWP), statistical methods, remote sensing, human expertise and hybrid methods. The accuracy of

Applications of GAN and VAEs in GIS

Here are a few examples of how Generative Adversarial Networks (GANs) and Variational Autoencoders (VAEs) have been used in Geographic Information Systems (GIS) applications:

  1. Generating synthetic satellite images: GANs have been used to generate synthetic satellite images of land cover, which can be used to train object detection models for land use classification. For example, a GAN can be trained on a dataset of real satellite images, and then used to generate new images that can be used to train a model to identify different types of land cover such as forests, urban areas, and croplands.

  2. Generating 3D models of buildings and terrain: GANs have been used to generate 3D models of buildings and terrain, which can be used to create virtual environments for urban planning and emergency management. For example, a GAN can be trained on a dataset of real 3D models of buildings, and then used to generate new models that can be used to simulate the effects of natural disasters or to plan for future development.

  3. Improving land use classification: VAEs have been used to generate new images of land cover, which can be used to improve the performance of existing land use classification models. For example, a VAE can be trained on a dataset of real images of land cover, and then used to generate new images that can be used to improve the performance of a model that is used to classify different types of land cover such as forests, urban areas, and croplands.

  4. Generating 3D models of building and terrain: VAEs can also be used to generate 3D models of buildings and terrain, which can be used to create virtual environments for urban planning and emergency management. For example, a VAE can be trained on a dataset of real 3D models of buildings, and then used to generate new models that can be used to simulate the effects of natural disasters or to plan for future development.

  5. Anomaly detection: VAEs can be used to detect anomalies in a GIS dataset such as satellite imagery. For example, a VAE can be trained on a dataset of normal images of land cover and can be used to identify abnormal images that could indicate the presence of an oil spill or a forest fire.

It’s worth noting that these are just a few examples of how GANs and VAEs have been used in GIS applications, and there are many other potential applications for these models. Additionally, These models are computationally intensive and require a lot of data and computational resources, so it’s important to carefully consider the feasibility of using these models for a specific GIS application.

GAN and VAEs in GIS

Generative Adversarial Networks (GANs) and Variational Autoencoders (VAEs) in Geographic Information Systems (GIS) applications.

GANs can be used to generate synthetic data, such as images and maps, that can be used to train other models or to improve the performance of existing models. For example, GANs have been used to generate synthetic satellite images, which can be used to train object detection models for applications such as land use classification and crop identification. GANs can also be used to generate 3D models of buildings and terrain, which can be used to create virtual environments for applications such as urban planning and emergency management.

VAEs can be used to learn a probabilistic representation of a dataset, such as images and maps, and to generate new data that is similar to the input data. For example, VAEs have been used to generate new images of buildings, roads, and land cover, which can be used to improve the performance of existing models or to create new models for applications such as land use classification and change detection. VAEs can also be used to generate 3D models of buildings and terrain, which can be used to create virtual environments for applications such as urban planning and emergency management.

It’s worth noting that, GANs and VAEs have been used for a variety of GIS applications, but there is still a lot of room for further research and development in this area. Additionally, These models are computationally intensive and require a lot of data and computational resources, so it’s important to carefully consider the feasibility of using these models for a specific GIS application.

In summary, GANs and VAEs can be used in GIS applications to generate synthetic data such as images, maps and 3D models of buildings and terrain, to learn a probabilistic representation of a dataset, and to generate new data that is similar to the input data. These models have a lot of potential for GIS applications, but more research is needed to fully realize their potential.

Ancient Maps and Modern Maps

Ancient maps and modern maps differ in a number of ways, including their level of accuracy, the information they convey, and the methods used to create them.

  1. Accuracy: Ancient maps were often created using limited information and technology, which resulted in less accurate depictions of the world. Modern maps, on the other hand, are created using advanced technology such as satellite imagery, aerial photography, and GPS, which allows for much higher levels of accuracy.

  2. Information: Ancient maps often focused on religious or mythological themes, rather than geographical information. They were also often symbolic and artistic in nature. Modern maps, on the other hand, focus on providing accurate and detailed geographical information, such as roads, cities, rivers, and topographical features.

  3. Methods: Ancient maps were often created using manual methods, such as drawing by hand or using simple tools like compasses and rulers. Modern maps are created using advanced technology, such as GIS (Geographic Information Systems) software, satellite imagery, and aerial photography.

  4. Representation: Ancient maps were often represented in the form of manuscripts, scrolls, or on stone tablets and were usually limited to the regions and cultures that produced them. Modern maps, on the other hand, are widely available, and digital maps are easily accessible and are often interactive.

  5. Purpose: Ancient maps were often created for religious, spiritual or political purposes, while modern maps are primarily created for practical uses such as navigation, transportation and land use.

It’s worth noting that some ancient maps were created with the best information and technology available at the time, and they could be accurate and useful for their intended purpose. However, compared to modern maps, ancient maps often lacked the level of accuracy and detail that is possible with current technology and methods. Additionally, the purpose of ancient maps was often more symbolic or religious than practical, and they often included elements such as gods, myths, and legends that were not found on modern maps.

In summary, the main differences between ancient and modern maps are their level of accuracy, the information they convey, and the methods used to create them. Ancient maps were often less accurate and focused on symbolic or religious themes, while modern maps are created using advanced technology and methods and focus on providing accurate and detailed geographical information.

50 potential GIS projects focusing on the creation of a GIS application for the Universiti Teknologi Malaysia campus

  1. Developing a GIS-based Campus Safety System
  2. Creating a GIS-based Energy Management System
  3. Developing a GIS-based Campus Maintenance System
  4. Building a GIS-based Transportation Management System
  5. Developing a GIS-based Campus Amenities System
  6. Creating a GIS-based Campus Event Management System
  7. Developing a GIS-based Campus Waste Management System
  8. Building a GIS-based Campus Water Management System
  9. Developing a GIS-based Campus Green Space Management System
  10. Creating a GIS-based Campus Food Services System
  11. Developing a GIS-based Campus Building Management System
  12. Building a GIS-based Campus Security System
  13. Developing a GIS-based Campus Disaster Management System
  14. Developing a GIS-based Campus Library Management System
  15. Building a GIS-based Campus Sports Facility Management System
  16. Developing a GIS-based Campus Health and Safety Management System
  17. Creating a GIS-based Campus Outdoor Space Management System
  18. Building a GIS-based Campus Emergency Management System
  19. Building a GIS-based Campus Parking Management System
  20. Developing a GIS-based Campus Bicycle Rental System
  21. Creating a GIS-based Campus Accessibility System
  22. Developing a GIS-based Campus Retail Management System
  23. Building a GIS-based Campus Environmental Monitoring System
  24. Developing a GIS-based Campus Emergency Services System
  25. Creating a GIS-based Campus Safety Audit System
  26. Building a GIS-based Campus Landscape Management System
  27. Developing a GIS-based Campus Recycling Management System
  28. Creating a GIS-based Campus Energy Conservation System
  29. Developing a GIS-based Campus Weather Monitoring System
  30. Building a GIS-based Campus Noise Pollution Management System
  31. Developing a GIS-based Campus Air Quality Monitoring System
  32. Creating a GIS-based Campus Water Conservation System
  33. Developing a GIS-based Campus Sustainable Transportation System
  34. Building a GIS-based Campus Fire Safety Management System
  35. Developing a GIS-based Campus Sewage and Waste Water Management System
  36. Creating a GIS-based Campus Wildlife Monitoring System
  37. Developing a GIS-based Campus Stormwater Management System
  38. Building a GIS-based Campus Asset Management System
  39. Developing a GIS-based Campus Building and Room Scheduling System
  40. Creating a GIS-based Campus Emergency Contact System
  41. Developing a GIS-based Campus Facilities Request System
  42. Building a GIS-based Campus Space Utilization System
  43. Developing a GIS-based Campus Event Planning and Coordination System
  44. Creating a GIS-based Campus Wayfinding and Signage System
  45. Developing a GIS-based Campus Safety Training and Education System
  46. Building a GIS-based Campus Emergency Evacuation System
  47. Developing a GIS-based Campus Resource Conservation System
  48. Creating a GIS-based Campus Land Use Planning and Zoning System
  49. Developing a GIS-based Campus Safety Inspection System
  50. Creating a GIS-based Campus Public Transit System

A young man named Ahmad [Part 10]

As Ahmad approaches the end of his career as an academician and GIS researcher, he feels a mix of emotions. On one hand, he is proud of all that he has accomplished and the impact that he has made in the field of GIS. On the other hand, he is tired from the years of hard work and dedication that he has put into his profession.

Ahmad reflects on all the people who have helped him along the way. He is grateful to his family, friends, and colleagues who have supported him through the years. He is also grateful to the students who have passed through his classes and who have been a source of inspiration to him. He is humbled by the impact that he has made on the lives of so many people.

As Ahmad gets ready for retirement, he knows that it is time for him to step back and let the next generation take over. He is ready to hand over the reigns and to enjoy the fruits of his labor. He wants to spend more time with his family and friends, to travel and to explore new places, and to live a life that is free from the stresses of work.

But at the same time, Ahmad doesn’t want to completely disconnect from the GIS community and he wants to continue to contribute to the development of the country. He wants to use his knowledge and experience to help others, to mentor young professionals and to share his insights with the next generation.

Ahmad knows that the future is uncertain, but he is at peace with that. He trusts that Allah will guide him on the path that is right for him. He is grateful for the opportunity to have lived a fulfilling life and to have made a difference in the world. May Allah put him in heaven with all good peoples and God’s blessing. InshaAllah.

The End.

A young man named Ahmad [Part 9]

Despite the challenges he faces as an academician, Ahmad remains determined to follow his passion and do what he loves. He knows that writing books will be a lot of work, but he is willing to put in the time and effort to make it happen. He doesn’t care what other people say, he is going to do what he wants.

Ahmad is fortunate to have the support of his family. They have always been there for him, encouraging him to pursue his dreams and follow his passions. With their encouragement, he knows that he can achieve anything he sets his mind to. He is grateful for their support, and it gives him the confidence to keep pushing forward.

Ahmad’s dedication and passion for GIS is admirable. He is determined to make a difference in the field and to share his knowledge and experience with others. His family’s support and encouragement will be a big help for him as he embarks on this new journey of writing books on GIS related topics. He is excited to see where this new venture will take him, and he is ready to face any challenges that come his way.

A young man named Ahmad [Part 8]

Despite the challenges he faces as an academician, Ahmad remains deeply committed to his work. He is passionate about sharing his knowledge and experience with others, and he sees writing books as a natural way to do so. He plans to write a series of books that cover a wide range of topics related to GIS and related fields, such as systems analysis and design, the development of web map servers and mobile applications, location-based services, programming, GIS data conversion, and GIS software systems.

By writing these books, Ahmad hopes to provide a valuable resource for both students and professionals in the field. He wants to share his expertise and insights in a way that is accessible, engaging, and informative. He also hopes that his books will help to inspire the next generation of GIS professionals, and encourage them to pursue their own research and development projects.

Ahmad knows that writing books will take a lot of time and effort, but he is excited about the opportunity to share his knowledge and experience with others. He is determined to make a positive impact on the field of GIS, and he believes that writing these books is a step in the right direction.