Category: Project

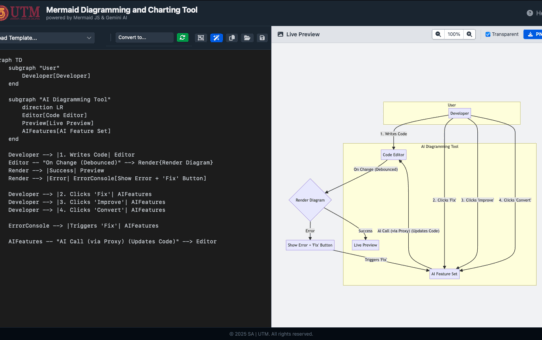
How I Built a Custom AI Chatbot for My University Courses
It’s 2 AM. A student is staring at a folder full of lecture slides, project guidelines, and 80-page PDFs. They have a specific question: “What are the submission requirements for Project Phase... Read More
Visualize Your Mount Ophir Adventure: Introducing the Ultimate Hiking Analyzer
Mount Ophir, or Gunung Ledang as it is famously known, is a rite of passage for many hikers in Malaysia. Its challenging trails and breathtaking summit view make every step of the journey worthwhile. ... Read More
The Making of the “Kalkulator Musafir & Waktu Solat” Web App
For the Muslim traveler, a journey of more than 81 kilometers is not just a change of location; it’s a transition into the state of a ‘musafir’, a traveler granted special dispensati... Read More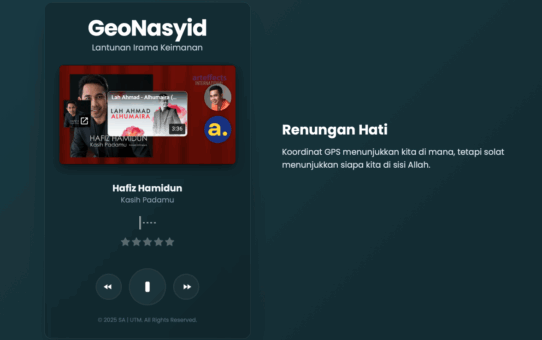
GeoNasyid: Lantunan Irama Keimanan
Alami kedamaian dan inspirasi melalui GeoNasyid, destinasi audio digital anda yang unik, menggabungkan alunan nasyid dan kata-kata motivasi. Dengan antaramuka yang moden dan menenangkan, GeoNasyid mem... Read More
Laporan Aktiviti Pembelajaran Servis (SULAM)
Oleh Shahabuddin Amerudin Program Konservasi Alam Bersama Komuniti Kg. Sungai Timun – Secara Fizikal telah dianjurkan pada 14 Jun 2025 sebagai sebahagian daripada pelaksanaan&nbs... Read More
Cross-Platform Development Frameworks and Tools for GIS Applications
By Shahabuddin Amerudin Introduction The increasing complexity and ubiquity of Geographic Information Systems (GIS) necessitate the adoption of flexible, scalable, and cross-platform development appro... Read More
The Evolving Landscape of GIS Software Systems: From Command Lines to the Cloud, AI & Beyond
By Shahabuddin Amerudin Geographic Information System (GIS) software serves as the foundational technology for capturing, storing, manipulating, analyzing, managing, and presenting all types of spatia... Read More
Theoretical Framework for AI and Predictive GIS in Pipeline Disaster Prevention
By Shahabuddin Amerudin The increasing frequency and severity of pipeline-related disasters, exemplified by the catastrophic 2025 Putra Heights gas explosion, highlight critical shortcomings in conven... Read More
Migrasi Data GIS: Transformasi dari Cassini dan RSO Lama ke Sistem GDM2000 dan WGS84
1. Keperluan Transformasi Sistem Koordinat GIS Sistem koordinat yang digunakan dalam pangkalan data GIS di Malaysia telah mengalami perubahan ketara dari era Cassini-Soldner (lama) dan RSO (lama)... Read More
The Origins of Surveying in Malaysia: A Historical Overview
By Shahabuddin Amerudin Early Beginnings (1832-1880s) Establishment of State Survey Departments (1885 onwards) The need for accurate surveys to support land registration led to: Early Datums and Grid ... Read More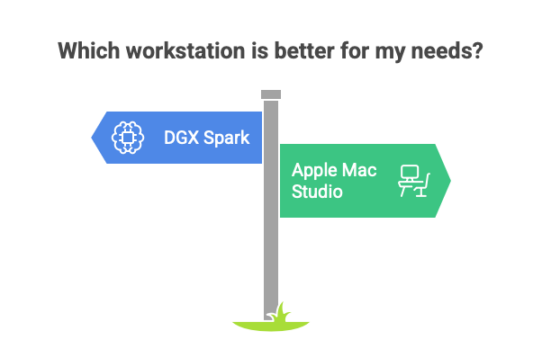
NVIDIA DGX Spark vs. Apple Mac Studio: Which AI Workstation Reigns Supreme?
By Shahabuddin Amerudin Introduction The NVIDIA DGX Spark is the latest innovation in AI computing, designed to bring supercomputer-level performance into a compact desktop-friendly form. Of... Read More
NVIDIA DGX Spark: A Compact AI Supercomputer
By Shahabuddin Amerudin 1. Introduction The launch of NVIDIA DGX Spark on March 18, 2025, marks a significant milestone in AI computing, bringing supercomputer-grade performance to the desktop. ... Read More
Choosing the Best Mac for AI/ML, GeoAI, and Local LLM Inference
By Shahabuddin Amerudin 1. Introduction Selecting the right computer for AI/ML, GeoAI development, and local LLM inference is a crucial decision that impacts long-term productivity, efficiency, and sc... Read More
Optimizing Hardware for Vector-Based GeoAI
By Shahabuddin Amerudin Introduction The growing field of Geospatial Artificial Intelligence (GeoAI) represents a fusion of spatial analysis with modern machine learning techniques. However, not all G... Read More
Investing in the Right Hardware for GeoAI
By Shahabuddin Amerudin In the rapidly evolving field of Geospatial Artificial Intelligence (GeoAI), hardware decisions can make or break a project’s feasibility and efficiency. As GeoAI applica... Read More
Choosing the Best Mac for AI/ML and GeoAI Development
By Shahabuddin Amerudin Artificial Intelligence (AI), Machine Learning (ML), and Geographic Artificial Intelligence (GeoAI) are computationally demanding fields that require high-performance hardware.... Read More
Advancing Modern GIS Software Systems: Key Technologies, Innovations, and Future Directions
By Shahabuddin Amerudin Introduction Geographic Information System (GIS) software has evolved significantly over the past few decades, driven by advancements in computing, data science, and decision s... Read More
Apple’s M4 Pro: A Game-Changer for AI and Machine Learning Professionals
In the rapidly evolving landscape of artificial intelligence (AI) and large language model (LLM) development, selecting the right hardware is paramount. Apple’s introduction of the M4 Pro chip o... Read More
