
Category: Research
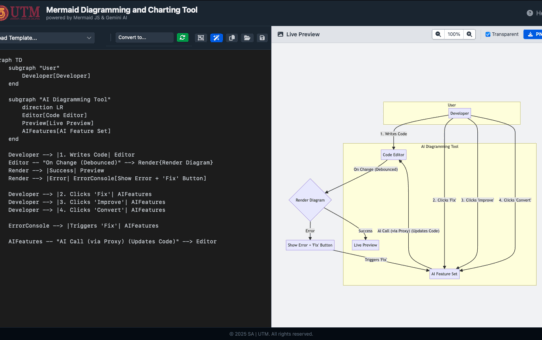
That “Parse Error” Feeling: Why We Gave Our Diagram Tool an AI Brain
We’ve all been there. You’re trying to map out a system, a user flow, or just a simple idea. You open a “Diagrams-as-Code” tool like Mermaid.js because you’re a developer, an... Read More
Visualize Your Mount Ophir Adventure: Introducing the Ultimate Hiking Analyzer
Mount Ophir, or Gunung Ledang as it is famously known, is a rite of passage for many hikers in Malaysia. Its challenging trails and breathtaking summit view make every step of the journey worthwhile. ... Read More
The Making of the “Kalkulator Musafir & Waktu Solat” Web App
For the Muslim traveler, a journey of more than 81 kilometers is not just a change of location; it’s a transition into the state of a ‘musafir’, a traveler granted special dispensati... Read More
Malaysian Coordinate Transformation & Projection
JOHOR BAHRU, 2 August 2025 – A new, powerful web-based calculator has been launched to streamline the complex process of Malaysian coordinate transformations, providing a crucial resource for s... Read More
Tesis Yang Tak Pernah Siap-Siap
Kau pernah tak…Buka fail thesis.Dan kau baca balik,Sampai satu masa — kau tak faham apa yang kau tulis. Ya… itu kau,Yang tulis.Yang karang dengan penuh semangat… tiga bulan lepas. Seka... Read More
Bila Tesis Tak Lagi Bergerak
Kau ingat dulu…Waktu mula-mula jumpa supervisor,Semangat kau macam baru beli laptop baru.Semua nampak mungkin. Tapi makin lama…Bab satu kau ulang-ulang baca,Bab dua macam tak nak lekat.Bab... Read More
Music that flows
Welcome to a new kind of listening experience. Music that flows with you (https://songs.kstutm.com) delivers a continuous, curated stream of music directly to your browser. More than just a playlist... Read More
Bila Supervisor Cari Kau
Biasanya…Kau yang kena kejar supervisor.Hantar mesej — tunggu balasan.Tanya soalan — tak semua dijawab. Tapi…Bila satu hari,Supervisor kau pula yang cari kau…Itu lain.Serius lain. Tengah scr... Read More
The Evolving Landscape of GIS Software Systems: From Command Lines to the Cloud, AI & Beyond
By Shahabuddin Amerudin Geographic Information System (GIS) software serves as the foundational technology for capturing, storing, manipulating, analyzing, managing, and presenting all types of spatia... Read More
The Future of Geographic Information Systems
By Shahabuddin Amerudin Introduction Geographic Information Systems (GIS) have been a cornerstone of spatial analysis and decision-making for decades, fundamentally transforming how organizations unde... Read More
Sejarah dan Evolusi Sistem Koordinat di Malaysia
Oleh Shahabuddin Amerudin Pengenalan Malaysia merupakan sebuah negara yang mempunyai kepentingan besar dalam pembangunan sistem koordinat dan pemetaan, terutamanya bagi tujuan geodetik, pemetaan, dan ... Read More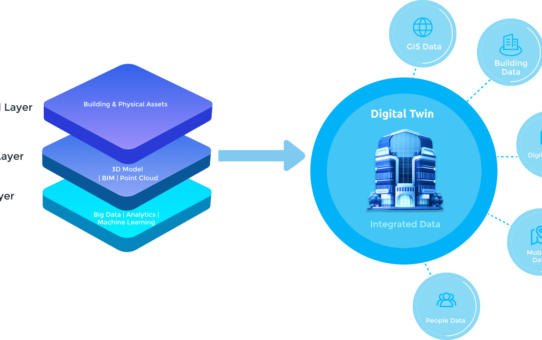
Advancing Digital Twins and GIS Integration
By Shahabuddin Amerudin In the 2021 article “Why Accenture lists ‘digital twins’ as top-five technology trend in 2021,” George Lawton (2021) explores the rising prominence of d... Read More
Singapore’s Country-Scale Digital Twin A Revolutionary Model for Smart Cities
By Shahabuddin Amerudin Introduction Singapore has been at the forefront of technological advancements in urban management and planning, with its ambitious initiative, Virtual Singapore. This project ... Read More
The Future of GIS and the Evolution of Emerging Concepts and Terminology
By Shahabuddin Amerudin Introduction For decades, Geographic Information Systems (GIS) have been the cornerstone of mapping, spatial analysis, and decision-making across a multitude of industries. Tra... Read More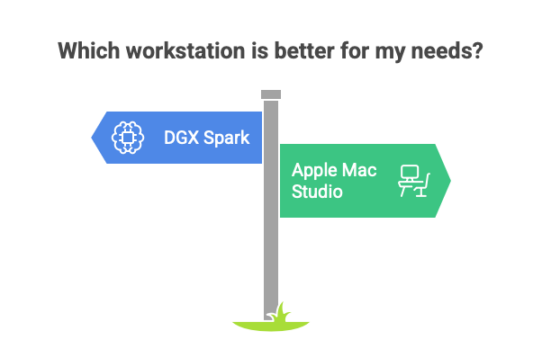
NVIDIA DGX Spark vs. Apple Mac Studio: Which AI Workstation Reigns Supreme?
By Shahabuddin Amerudin Introduction The NVIDIA DGX Spark is the latest innovation in AI computing, designed to bring supercomputer-level performance into a compact desktop-friendly form. Of... Read More
Optimizing Hardware for Vector-Based GeoAI
By Shahabuddin Amerudin Introduction The growing field of Geospatial Artificial Intelligence (GeoAI) represents a fusion of spatial analysis with modern machine learning techniques. However, not all G... Read More
Advancing Modern GIS Software Systems: Key Technologies, Innovations, and Future Directions
By Shahabuddin Amerudin Introduction Geographic Information System (GIS) software has evolved significantly over the past few decades, driven by advancements in computing, data science, and decision s... Read More
Apple’s M4 Pro: A Game-Changer for AI and Machine Learning Professionals
In the rapidly evolving landscape of artificial intelligence (AI) and large language model (LLM) development, selecting the right hardware is paramount. Apple’s introduction of the M4 Pro chip o... Read More
