Category: Teaching

Laporan Aktiviti Pembelajaran Servis (SULAM)
Oleh Shahabuddin Amerudin Program Konservasi Alam Bersama Komuniti Kg. Sungai Timun – Secara Fizikal telah dianjurkan pada 14 Jun 2025 sebagai sebahagian daripada pelaksanaan&nbs... Read More
Malaysian Coordinate Transformation & Projection
JOHOR BAHRU, 2 August 2025 – A new, powerful web-based calculator has been launched to streamline the complex process of Malaysian coordinate transformations, providing a crucial resource for s... Read More
Tesis Yang Tak Pernah Siap-Siap
Kau pernah tak…Buka fail thesis.Dan kau baca balik,Sampai satu masa — kau tak faham apa yang kau tulis. Ya… itu kau,Yang tulis.Yang karang dengan penuh semangat… tiga bulan lepas. Seka... Read More
Bila Tesis Tak Lagi Bergerak
Kau ingat dulu…Waktu mula-mula jumpa supervisor,Semangat kau macam baru beli laptop baru.Semua nampak mungkin. Tapi makin lama…Bab satu kau ulang-ulang baca,Bab dua macam tak nak lekat.Bab... Read More

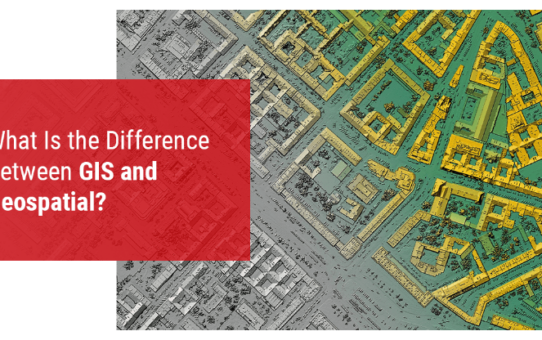
Demystifying Key Terminologies in Modern GIS Deployment and Performance
By Shahabuddin Amerudin The field of Geoinformatics is rapidly evolving, driven by advancements in data acquisition, processing power, and software systems. For today’s GIS professionals and stu... Read More
Cross-Platform Development Frameworks and Tools for GIS Applications
By Shahabuddin Amerudin Introduction The increasing complexity and ubiquity of Geographic Information Systems (GIS) necessitate the adoption of flexible, scalable, and cross-platform development appro... Read More
Lessons from Final Year Project Progress Presentations: Bridging Theory and Practice
By Shahabuddin Amerudin Introduction The mid-term progress presentations of final year Geoinformatics projects offer valuable insights into how students navigate the transition from conceptual framewo... Read More
Bila Supervisor Cari Kau
Biasanya…Kau yang kena kejar supervisor.Hantar mesej — tunggu balasan.Tanya soalan — tak semua dijawab. Tapi…Bila satu hari,Supervisor kau pula yang cari kau…Itu lain.Serius lain. Tengah scr... Read More
GIS Software Customisation and Development: A Comprehensive Overview
By Shahabuddin Amerudin Introduction Geographic Information Systems (GIS) have become indispensable tools for organizations across various sectors, transforming raw geographic data into valuable insig... Read More
Evolution of the Geospatial Industry
The YouTube video provides an in-depth overview of the development and transformation of the geospatial industry over time. It traces the origins of Geographic Information Systems (GIS), highlighting... Read More
The Evolving Landscape of GIS Software Systems: From Command Lines to the Cloud, AI & Beyond
By Shahabuddin Amerudin Geographic Information System (GIS) software serves as the foundational technology for capturing, storing, manipulating, analyzing, managing, and presenting all types of spatia... Read More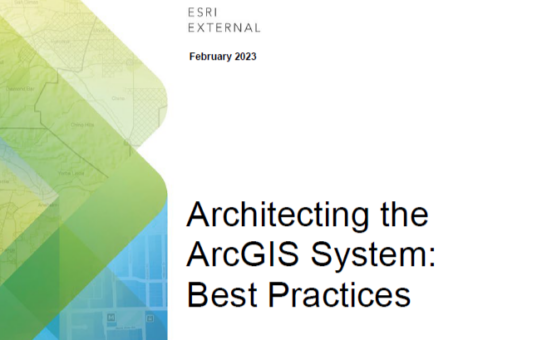
Architecting the ArcGIS System
1. Introduction Designing an effective ArcGIS Enterprise deployment requires careful architectural planning to meet the needs of diverse organizational requirements. A successful deployment is not sol... Read More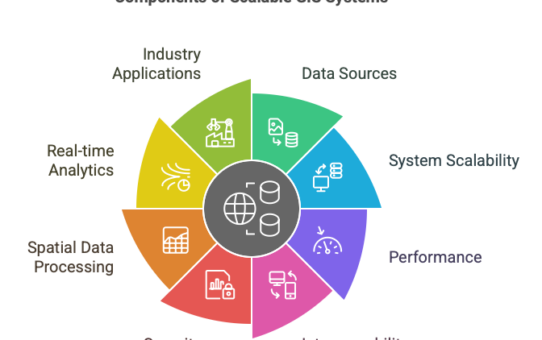
Scalable GIS System Architecture
By Shahabuddin Amerudin Introduction Geographic Information Systems (GIS) have undergone a profound transformation from static cartographic platforms to dynamic, high-throughput geospatial intelligenc... Read More
The Future of Geographic Information Systems
By Shahabuddin Amerudin Introduction Geographic Information Systems (GIS) have been a cornerstone of spatial analysis and decision-making for decades, fundamentally transforming how organizations unde... Read More
Migrasi Data GIS: Transformasi dari Cassini dan RSO Lama ke Sistem GDM2000 dan WGS84
1. Keperluan Transformasi Sistem Koordinat GIS Sistem koordinat yang digunakan dalam pangkalan data GIS di Malaysia telah mengalami perubahan ketara dari era Cassini-Soldner (lama) dan RSO (lama)... Read More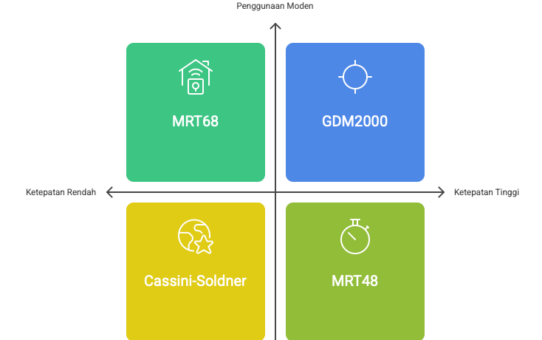
Sistem Koordinat di Malaysia Secara Ringkas
Oleh Shahabuddin Amerudin Pengenalan Sistem koordinat di Malaysia telah berkembang secara progresif dari zaman penjajahan hingga era moden. Perubahan ini mencerminkan keperluan untuk ketepatan geodeti... Read More
Sejarah dan Evolusi Sistem Koordinat di Malaysia
Oleh Shahabuddin Amerudin Pengenalan Malaysia merupakan sebuah negara yang mempunyai kepentingan besar dalam pembangunan sistem koordinat dan pemetaan, terutamanya bagi tujuan geodetik, pemetaan, dan ... Read More