![]() By Materials Performance on 6/29/2017 3:23 PM
By Materials Performance on 6/29/2017 3:23 PM
The guide’s purpose is to present a practical, easy-to-use document to identify, compare, and select protective coating systems that are cost-effective for specific environments.
To help coatings engineers or specifiers determine candidate protective coating systems for particular industrial environments, NACE International members Jason Helsel and Robert Lanterman developed a practical guide, “Expected Service Life and Cost Considerations for Maintenance and New Construction Protective Coating Work” (CORROSION 2016 paper no. 7422). This guide discusses commonly used generic coating systems and the service life for each in specific environments; current costs for materials and their application (both shop- and field-applied); and guidelines for calculating installed system costs. The authors comment that specific job costs will vary depending on the characteristics of a project, and note that the guide’s purpose is to present a practical, easy-to-use document to identify, compare, and select protective coating systems that are cost-effective for specific environments.
To identify the costs of surface preparation, coating application, and materials for typical industrial environments, as well as the available generic coatings used in those environments and the expected service lives of those coatings, a survey was implemented to collect information from major protective coatings manufacturers, steel fabricators, painting contractors, and end users. Cost data were developed from collected data as well as common industry cost references.
The authors use a “practical life” maintenance approach in the guide for projecting the life of the coating system, which estimates the service life as the number of years before first maintenance painting should begin—when the coating exhibits 5 to 10% breakdown and active rusting of the substrate is present—rather than the time until a coating system needs to be replaced.
Data tables in the guide for the estimated practical service life of coating systems include information such as generic coating types (i.e., acrylic, alkyd, epoxy, epoxy phenolic, epoxy zinc, organic zinc, inorganic zinc, metalizing, moisture curing polyurethane, and miscellaneous coatings); types of surface preparation—hand or power tool cleaning or abrasive blast cleaning; number of coats; and minimum dry film thickness (DFT) of the coating. Coating types are grouped into categories for either atmospheric exposure or immersion (water) service. Coating life-expectancy information corresponds to the corrosivity of the service environments. The harshness of atmospheric service is classified as C2 through C5 for mild, moderate, severe (heavy industrial), and seacoast heavy industrial, as defined in ISO 12944-2, “Classification of Environments.” The service environments corresponding to immersion service include potable, fresh, and salt water immersion.
Generally, the authors say, most users follow a maintenance painting sequence of spot touch-up and repair, then maintenance repaint (spot prime and full coat), and finally full repaint (total coating removal and replacement). They estimate the number of years for a practical maintenance sequence as follows: spot touch-up and repair at the practical life (P) of the coating system, maintenance repainting at the coating system’s practical life plus 33% (P x 1.33), and full repaint at the coating’s practical life plus 50% (P x 1.5).
Helsel and Lanterman emphasize that distribution of coating breakdown must also be taken into account when judging the costs and feasibility of maintenance painting. “For example, 5% breakdown that occurs in well-defined areas can be practically repaired through localized touch-up, whereas 5% breakdown uniformly scattered across 100% of the surface may be beyond practical spot repair,” they say.
Also, the authors point out that the practical maintenance sequence may not always represent the most economical approach to maintenance painting. The physical characteristics of the existing coating and the amount of corrosion present are the determining factors, and it may be possible to perform several touch-up and maintenance repainting cycles and push the time until full repainting is required. They note that the decision to conduct a maintenance repaint vs. a full repaint should be based on results of a coating investigation that assesses coating thickness, adhesion, substrate condition, and the extent and distribution of corrosion.
The guide also presents a data table with the estimated material cost per square foot for particular paints/protective coatings based on a typical DFT for that coating. Coatings listed include various acrylics, alkyds, epoxies, polyurethanes, siloxanes, zinc-rich coatings, and others.
Additionally, data tables are presented for non-material costs for shop painting and field painting, which include costs per square foot for surface preparation, application labor for various types of shop coatings (one-pack products, two-pack epoxies and urethanes, zinc-rich primers, and plural component spray) and field coatings (one-pack brush/roller and spray, two-pack spray epoxies and urethanes, spray zinc-rich primes, and plural component spray); equipment; and other related costs. The authors comment that the practical life of the coating and the cost of the repainting steps will vary depending upon whether the original coating was applied in the shop or in the field and provide an example of cost estimates for a typical maintenance painting sequence for both shop-applied and field-applied original coatings.
To compare the costs of one coating system to another, Helsel and Lanterman comment that the time table for maintenance painting, the number of maintenance painting cycles required to achieve the structure’s desired life, and the cost of these painting operations at current cost as well as net present value and net future value, should be noted. The guide provides several calculations to determine net present value and net future value, along with examples. With this information, the cost of a coating system for long-term protection over the structure’s life can be determined, which gives the user a comparable basis for selecting a coating system.
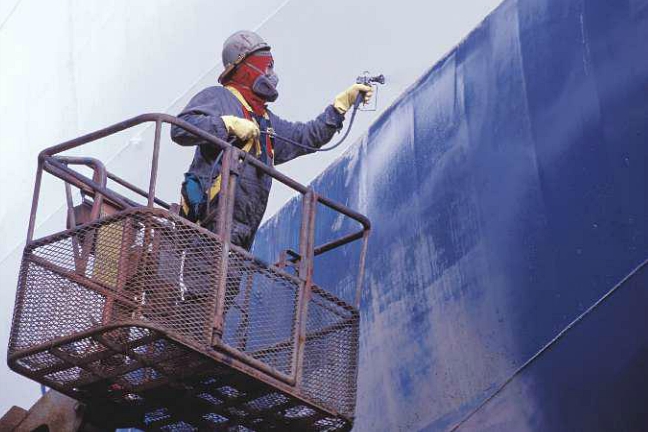
 A worker cleans the surface of a column in a ship’s tank.
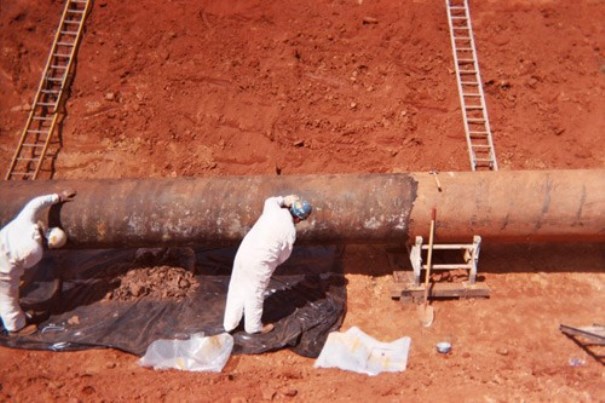 An aging pipeline is being prepared for recoating. Photo courtesy of Jeffrey Didas.


 processed by software developed in-house based on an artificial neural network. This software classified the examined tower foundations into one of four corrosion risk categories (low, medium, high, and very high). The results showed ~60% of the selected foundations were placed in either the high or very high corrosion risk groups.
 by discrete zinc anodes and (b) zinc sheet anodes.")


 with one or more DOT-reported internal corrosion incidents, 1970 through 2013.")


 and after testing (above). Photos courtesy of Shiladitya Paul.")