Detecting corrosion through data

Written by  Matt Jones and Jim Sokolowski, Tessella Thursday, 01 June 2017 00:00

Matt Jones and Jim Sokolowski, of Tessella, show how data analytics can give insight into corrosion rates to reduce risk and maintenance costs.

Riser and slip joint on a semisubmersible oil rig. Photo from iStock.

Corrosion is a fact of life in offshore environments, and offshore production costs are significantly impacted by it. It is often a known unknown, and this makes business and investment decisions that need to consider its impact harder and riskier.

This offers an even trickier proposition when facilities are nearing the end of their life and alternatives, such as carbon capture and storage (CCS) in depleted reservoirs, are being considered.

Such an alternative was being considered by an operator in the North Sea. But, the firm wanted to understand the possible causes of corrosion on its existing facility, to be able to predict future corrosion accurately. These insights could be used to make other decisions, such as how to optimally plan expensive corrosion re-measurement campaigns.

The company had just less than 10 years of historical eddy current data about surface casing and conductor corrosion from scheduled measurement campaigns, as well as original spud data. However, there was a need to truly understand what this data meant. The data showed that some wells had significantly worse corrosion than others that appeared to be “similar,” but they were unsure why.

As mentioned, some of the historical data was eddy current measurements – a common corrosion test by which a magnetic field is applied to the material, and variations in the electrical conductivity and magnetic permeability are used to map corrosion – and there were significant questions about the validity of these measurements. Taking accurate corrosion measurements like these are complex and often the uncertainties and errors can be so large that the measurement ranges from useful, to useless.

Tessella started a first principles analysis to deepen the understanding of the root cause of corrosion by exploring 20GB of data acquired from historical operational measurements from the PI historian, captured over nearly 20 years. The data did not require special processing or cleaning prior to use.

Our data scientists explored the time histories of all the operational data for temperatures, pressures, production rates and water rates, and used a range of statistical techniques (principal component analysis, dimensionality reduction and cluster identification) to find structure in this history. They examined whether any of these clusters correlated with the corrosion levels, then drilled down into the underlying variables to understand what element in the historical record was driving this.

By applying knowledge of corrosion chemistries and environmental mechanisms that accelerate the corrosion process, the operational details from the historic data could be used to determine possible likely causes of the high corrosion in the affected casing.

Next, Tessella’s data scientists focused on estimating the future corrosion of casings in a new study in a depleted field, to help assess its potential long-term use in a CCS capacity.

This work had started from a scientific publication in 2005 that had presented a methodology to estimate corrosion rates more effectively. The approach assumes a particular stochastic corrosion model, and then uses Bayesian probability techniques to estimate the associated parameters, such as mean corrosion rate.

The analytics team then enhanced this Bayesian approach to be more appropriate to the issue of interest. This required analyzing and modeling the errors in the corrosion measurement process, developing a new understanding, as well as leveraging prior information using data from previous fields.

The resulting models were able to predict mean corrosion rates of well casings across the second depleted field, as well as associated uncertainties and also sensitivities of the results to the various assumptions made. This allowed our data scientists to understand how far existing infrastructure has corroded, and predict the associated future lifetime, and hence suitability, for use in the CCS context.

In addition, the analysis showed the ability to optimize future corrosion measurement campaigns based on individual well corrosion predictions and uncertainties, with associated cost savings.

The key to successful data projects

There are several factors that made this data project a success. First, there was a clear objective and business question. The approach was then focused on using the data to look for the insight needed.

Second, those involved understood the business, scientific and engineering challenge, as well as the data. Meaning, the context of what the data was telling them was understood, and they could hypothesize about what correlations mean, and then rigorously test them to establish causation.

Finally, the project looked at how data could quickly address a specific problem and in a timescale of weeks, not years. By taking the right approach, data analytics can deliver real business value, quickly.

Crevice Corrosion, And What To Do About It

This type of metal corrosion occurs at or near areas where metal parts are joined in buildings and on other assets.

By Michael Harkin

Everything might look fine when metal components are joined, but even small gaps between fixtures are open invitations to what is known as crevice corrosion. Left unchecked, crevice corrosion can cause significant degrading of assets — leading to costly repairs, loss of production, and even failure of entire systems.

To ensure assets remain productive and safe, it’s important to understand what crevice corrosion is, how it happens, how to identify it on your metal assets, and what you can do to prevent this metal corrosion.

What Is Crevice Corrosion?

Crevice corrosion is a localized corrosion attack at or very near the gap, or crevice, between joined surfaces that are exposed to corrosives like air or water. It occurs when chemical concentrations differ between separate points near joined surfaces.

metal corrosion
An example of crevice corrosion

Also known as deposit or gasket corrosion, this type of corrosion is often the result of stagnant solutions stuck in shielded areas protecting joined metal surfaces.

For example, if overlapping metal plates are exposed to air, water, or other corrosive environments, corrosive solutions can seep into even the smallest of gaps between the plates. The resulting chemical reactions can cause corrosion that eats into one or both metals. This causes a loss of weight and strength in the metal and increases the risk of failures due to metal fatigue.

Crevice corrosion is most common in areas where metal components are joined. For example, it can occur where beams or plates are joined by rivets or pipe valves are bolted together. Under the right environmental conditions, crevice corrosion is always a threat and is especially challenging to combat if you don’t know what to look for.

Some visible signs of crevice corrosion include:

  • localized discoloration of the paint that is covering an area at or near where metal parts are joined;
  • localized flaking of protective coatings at or near the corrosion site; and
  • localized flaking of one of the metals at the area where two metals are joined.

It is important to remember that crevice corrosion may not always be immediately visible because it can occur in areas obscured by protective shields.

Preventing Crevice Corrosion

The best defense against crevice corrosion is being proactive in the project planning of an asset, including considering the following:

  • using welded butt joints instead of riveted or bolted joints;
  • incorporating non-absorbent gaskets made of Teflon; and
  • using higher alloys that more strongly resist crevice corrosion.

To defend against crevice corrosion in existing assets, be sure to fully drain and dry any assets exposed to water or other solutions and avoid creating stagnant conditions that can spur corrosion. Also, locate existing crevices in overlapping joints and use continuous welding or soldering to seal the gap. Partial asset redesigns during facility maintenance or repair may be necessary to prevent future crevice corrosion attacks.

Whether you’re designing new assets or curbing the risk of corrosion in existing ones, consulting a corrosion control expert will help improve results. These professionals provide thorough surveys of existing assets to identify possible trouble spots and offer solutions to stop crevice corrosion before it’s too late.metal corrosion

Harkin is a NACE and SSPC coating inspector and current President of FeO, a QP5-certified coating inspection and consulting company located in Virginia Beach, VA. Prior to FeO, Harkin served as an Army soldier and a Marine Corps officer.

Galvanic Corrosion, And What To Do About It

This type of metal corrosion can cause serious failures, but understanding the factors and chemistry behind it goes a long way toward prevention.

By Michael Harkin

Galvanic corrosion refers to the damage that occurs to an asset when two different kinds of metal are joined in a corrosive environment. When the environmental conditions are right and the metals are in electrical contact with one another, one of the metals will corrode more quickly than if it were on its own while the other will corrode much more slowly.

While galvanic corrosion can cause serious failures, preventing it is as simple as understanding the factors and chemistry behind it, designing against it and planning ahead for it if assets must be exposed to the elements.

Sometimes exposing assets made of different kinds of metals to the elements is unavoidable. With that comes the risk of a degradation of one metal due to its proximity to another coupled with the right environmental conditions.corrosion

Metals that are prone to this corrosion are known as anodes; metals resistant to it are known as cathodes. The risk of galvanic corrosion depends on the chemical properties of the metals of an asset. As the Galvanic Series illustrates, metals like gold, platinum and titanium are more cathodic (also known as more noble) and are therefore more resistant to corrosion. Metals like magnesium, zinc, beryllium and aluminum alloys are more anodic (less noble) and are more susceptible to corrosion. The greater the difference between metals on the Series, the higher the risk of galvanic corrosion if the two are paired in a corrosive environment.

Single pieces made of high-alloy metal also are at risk if the different metals present are far apart on the Galvanic Series and if the piece is exposed to a corrosive environment.

Preventing Galvanic Corrosion

The most effective way to prevent galvanic corrosion is to understand the Galvanic Series and design assets using metal combinations that won’t support the genesis of the corrosion. For example, joining metals that are farther apart on the Galvanic Series (such as titanium and aluminum) increases the risk of galvanic corrosion. Similarly, joining metals that are closer together on the scale (such as tin and copper) reduces the risk.

corrosion
Example of galvanic corrosion

Time, resources, and even lives can be saved far in advance when asset designers know the risks associated with galvanic corrosion and eliminate those risks before they ever become a problem. Sometimes, though, asset specifications require joining certain metals. There are two prevention options when the risk of damage due to galvanic corrosion is inevitable:

Control the environment. If assets don’t need to be in corrosive environments, see that they aren’t introduced to or stored within them to reduce the risk of corrosion.

Coat the asset. The proper protective coating can prevent corrosion if the asset will encounter corrosive environments.

Galvanic Corrosion: Extend Asset Life?

In a number of industries, galvanic corrosion can be used to actually lengthen the life of an asset. Attaching a piece of metal to a surface that’s higher on the Galvanic Series will spur corrosion of the anodic metal while protecting the meaningful, more cathodic parts of an asset that otherwise would have been at risk. This technique is called “cathodic protection” and is a popular — although at times expensive — option for hard-to-reach surfaces like the hull of a ship or a buried pipeline.

There are some tradeoffs with cathodic protection. Developing a cathodic protection system for an asset is more expensive than just using a traditional “barrier” methods like coating the surface. Additionally, maintenance managers must keep a constant watch on sacrificial anodes, replacing them frequently to ensure maximum corrosion protection. Also, avoid putting any type of protective coating over sacrificial anodes which will negate their effectiveness.

Inspect And Plan Accordingly

Galvanic corrosion is a significant and costly issue that often leaves asset owners and operators overwhelmed and frustrated. But there are ways to fight the good fight and achieve true peace of mind about the state of your asset. Finding a trusted partner to conduct surveys and develop corrosion control and prevention plans goes a long way to ensuring long, safe, and useful lives for assets.corrosion

Harkin is a NACE and SSPC coating inspector and current President of FeO, a QP5-certified coating inspection and consulting company located in Virginia Beach, VA. Prior to FeO, Harkin served as an Army soldier and a Marine Corps officer.

Pitting Corrosion, And What To Do About It

This type of corrosion may be difficult to detect and can cause serious damage to critical infrastructure and industrial assets.

By Michael Harkin

Pitting corrosion is a localized breakdown of metal manifesting in small cavities or “pits” visible on a metal surface. These are tiny, and some are nearly invisible, but the damage these cause can be deadly to infrastructure and industrial assets. Case in point: Pitting corrosion is believed to be the cause of a deadly bridge collapse in 1967. Forty-six people died when the U.S. Highway 35 bridge between Point Pleasant, WV and Kanauga, OH fell into the Ohio River.

infrastructure
U.S Highway 35 bridge (Image: West Virginia Dept. of Transportation)

Investigators determined a small crack formed when one of the bridge’s eyebeams was cast decades before the collapse. The eyebar broke under the compounding stresses of a corrosive environment and newer, heavier vehicles traversing the bridge.

Understanding what pitting corrosion is, how it starts and how to prevent it goes a long way to ensuring long, safe and useful service for metal assets exposed to the elements.

Pitting Corrosion: How Does It Start?

There’s more to the pits indicative of a pitting corrosion attack than meets the eye. Far more damage is done beneath the metal surface because pitting corrosion bores inward. Pitting corrosion causes the loss of metal thickness. That translates to a loss of structural integrity that can lead to stress cracking due to metal fatigue.

infrastructure
Example of pitting corrosion on metal

For example, if a beam that bears a heavy load loses thickness and mass due to corrosion, there’s less beam available to support the weight. The attack could go unnoticed but, over time, the fatigue this causes could lead to the formation of cracks. Cracks can quickly lead to a failure of the beam, which could set off a catastrophic chain reaction as unplanned stresses multiply.

There are several potential causes for pitting corrosion on infrastructure and industrial assets, including the following:

  • Localized mechanical or chemical damage to a metal’s protective oxide film
  • Improper application of corrosion control products
  • The presence of non-metal materials on the surface of a metal

When metals that aren’t properly treated are freely exposed to the elements, chemical reactions between metals and the environment form compounds like ferrous oxide, more commonly known as rust.

Preventing Pitting Corrosion

Preventing pitting corrosion starts early. First and foremost, choosing the right metal during the design of an asset makes a big difference. The risk of pitting corrosion is greatly reduced when you know ahead of time how materials react in different environments. Higher-alloy metals resist corrosion more strongly than do low-alloy materials.

Next, control the environment to the extent it is possible. For indoor or sheltered assets, keeping environmental factors like temperature, pH, and chloride concentration in check minimizes the risk of pitting corrosion, ensuring a long useful life for your assets.

Finally, apply the proper industrial coating to the assets and have these inspected regularly by trained corrosion control experts. It’s recommended that the experts hired by facility owners use modern non-destructive testing (NDT) methods to survey the condition of metal assets without causing needless damage.infrastructure

Harkin is a NACE and SSPC coating inspector and current President of FeO, a QP5-certified coating inspection and consulting company located in Virginia Beach, VA. Prior to FeO, Harkin served as an Army soldier and a Marine Corps officer.

Corrosion Management and Cost Optimization

By Ali Morshed on 6/1/2017 11:57 AM

Improvement in the optimization of corrosion costs can boost the financial bottom line for many oil and gas assets.
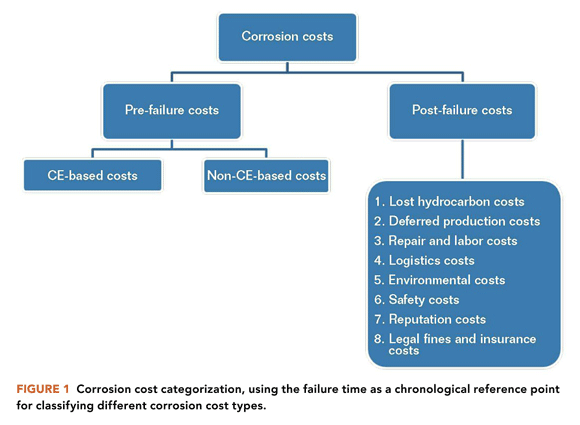
Optimizing corrosion costs can markedly affect the overall integrity management costs for many oil and gas assets. Corrosion costs can be divided into pre-failure and post-failure categories. Preventing corrosion failures to the extent possible will eliminate or minimize post-failure corrosion costs. On the other hand, pre-failure corrosion costs may be further divided into corrosion engineering (CE)-based and non-CE-based costs.
The definition offered herein for the concept of corrosion cost optimization renders it almost fully congruous with the corrosion management concept. That means proper and timely corrosion management applications could facilitate corrosion failure preemption, while simultaneously optimizing both CE-based and non-CE-based corrosion costs.

Corrosion Cost Categorization

There are many different types of corrosion-related costs and different ways of simultaneously classifying or categorizing them. In this approach, the time to failure during an asset’s operation phase is used as a chronological reference point for corrosion cost categorization, as illustrated in Figure 1. Therefore, based on this methodology, there are two main types of corrosion costs: pre-failure and post-failure.

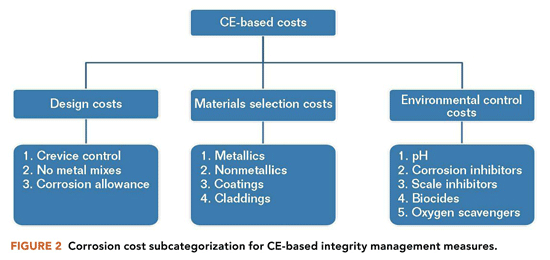
The pre-failure corrosion costs are further divided into CE-based and non-CE-based costs, which pertain to the corresponding integrity management measures. CE-based costs are divided into three smaller subcategories, as illustrated in Figure 2. Some CE-based costs in these subcategories are closely associated with an asset’s design stage (e.g., corrosion allowance and materials selection costs), while others are largely determined during the design stage and materialize during the asset’s operation stage (e.g., corrosion inhibitor and biocide injection costs).

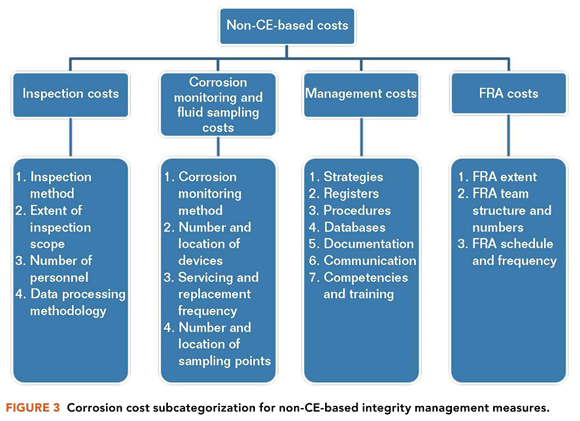
Non-CE based corrosion costs are divided into the following four subcategories:

• Inspection costs

• Corrosion monitoring and fluid sampling costs

• Management costs (e.g., producing or updating strategies, procedures, databases, various documentation, communication, and the corrosion management strategy document)

• Failure risk assessment (FRA) activities costs

Figure 3 illustrates those parameters or variables which influence the four non-CE-based costs.

Post-failure corrosion costs include, but are not limited to:

• Lost hydrocarbon and deferred production costs

• Repair and labor costs

• Reputation costs

Once the different types of corrosion costs are fully identified—their origins together with the variables that determine and influence their magnitude, extent, and duration—planning can begin for optimizing these costs. Such corrosion cost optimization must be accomplished without sacrificing the performance and efficiency of any of the asset’s incumbent or future CE-based or non-CE-based integrity management measures.

Cost Optimization Definition

After clearly defining and understanding the various components of the corrosion-related costs, corrosion cost optimization can be defined as managing the cost of both CE-based and non-CE-based integrity management measures in such a way that corrosion failures are kept to a minimum (ideally zero) while the efficiency and performance of these measures are not sacrificed, compromised, or adversely affected.

The following points could be further highlighted with regard to the above definition:

• By preventing corrosion failures or minimizing the number of their occurrences as much as possible, a significant portion of corrosion costs (Figure 1) can be avoided, thereby markedly reducing the overall corrosion cost figure.

• Not all corrosion costs pertain to an asset’s operation phase; a significant portion is associated with the design phase. Hence, a proper design process could play a major positive role in optimizing the overall corrosion costs.

• By definition,1 corrosion management incorporates both CE-based and non-CE-based integrity management measures exactly as corrosion cost optimization does. Therefore, thorough implementation of corrosion management applications can significantly affect and optimize overall corrosion costs.

Corrosion Management and Cost Optimization

A comparison of the corrosion management concept1 and corrosion cost optimization reveals marked congruity between the two. Both concepts incorporate components such as CE-based and non-CE-based integrity management measures. Thus, such similarity means that adequate and proper corrosion management implementation can influence both CE-based and non-CE-based measures in such a way that the extent and effectiveness of these measures are not compromised, yet potential corrosion failures are preempted as much as possible (i.e., the near total elimination of the post-failure corrosion costs), and pre-failure corrosion costs are also optimized.

Eliminating the post-failure corrosion costs (via preempting potential corrosion failures) is achieved through proper application of CE-based and non-CE-based integrity management measures, which themselves are best optimized through proper corrosion management implementation. The following two sections describe in more detail how such corrosion management implementation can enhance both CE-based and non-CE-based integrity management measures and simultaneously optimize their pertinent costs, thereby optimizing the overall corrosion costs.

Optimizing Corrosion Engineering-Based Costs

CE-based costs are divided into the following three subcategories:

• Design costs (e.g., corrosion allowance)

• Materials selection costs (e.g., metallic and non-metallic options)

• Environmental control costs (e.g., corrosion inhibitor injection)

The variables listed under each subcategory (Figure 2) determine the total cost associated with that subcategory and contribute to the overall CE-based cost.

A very important point is highlighted here regarding the upstream hydrocarbon assets and their associated pipelines. The costs associated with these three CE-based subcategories are very much dependent on conducting proper well sampling and the accuracy of sample analyses during an asset’s design stage. Any erroneous conclusions regarding the corrosivity level of the produced fluids can have huge adverse repercussions. Conclusions that fluid corrosivity is greater than is actually the case can increase design-stage costs when implementing the following:

• Specifying thicker corrosion allowances

• Selecting corrosion-resistant alloys (CRAs), which are typically more expensive than carbon steel

• Including inner coatings or claddings instead of, or in addition to, corrosion inhibitor injection for internal protection of equipment

• Injecting higher-than-necessary concentrations of various chemicals (e.g., corrosion inhibitors)

Thus, opting for such overdesign options, due to erroneous fluid sampling and/or compositional analysis, could have a huge adverse effect on the overall CE-based costs at the design stage. Some components of such overdesign options at the design stage (e.g., overdosed chemical treatment) could also continue well into an asset’s operation stage before (if at all) they are rectified.

Furthermore, asset underdesign based on sampling/analyses errors may appear to have optimized corrosion costs at the design stage; however, such assets can suffer from the following corrosion costs post-commissioning:

• Increased CE-based costs such as material replacements or corrosion allowance upgrades along with injection of higher doses of chemicals to control or reduce an increasing number of corrosion failures due to an underdesign

• Increased post-failure corrosion costs due to inadequate corrosion control measures that result in earlier and more frequent failures than expected in an asset’s life

The best way to optimize CE-based corrosion costs is to avoid both overdesigned and underdesigned corrosion control measures, while requiring that fluid sampling and analyses are carried out in an accurate and meticulous manner.

It is of paramount importance to remember that CE-based cost optimization commences at the design stage and continues throughout the operation stage. Any revisions, alterations, or variations in the incumbent corrosion measures during the operating stage will directly influence the overall CE-based corrosion costs.

Optimizing Non-Corrosion Engineering-Based Costs

As illustrated in Figure 3, non-CE-based corrosion costs are divided into four subcategories that are associated with different integrity management measures. The cost optimization pertaining to each measure is discussed individually.

Inspection-Related Costs

Inspection-related costs are best optimized if the inspection scope is fully risk-based. A conservative inspection scope can mean unnecessary inspection costs. Conversely, a scope that is not risk-based and has fewer selected points (compared to a risk-based scope) may not detect high-risk or high-corrosion-rate areas. That means there is a greater likelihood of failure and the occurrence of post-failure corrosion costs.

Corrosion Monitoring and Fluid Sampling Costs

This situation is exactly the same as inspection-related costs. A conservative approach to corrosion monitoring and fluid sampling creates unnecessary costs. On the other hand, a less conservative approach increases the chance that higher corrosion rates are not detected, which can possibly lead to failures and their associated post-failure corrosion costs.

Management Costs

Many costly corrosion failures are related to inadequate or totally absent items such as registers, databases, communication, and competency (Figure 3). Furthermore, their creation (if they do not already exist) or updating can be done often at little or no cost. Producing and updating such items can significantly improve corrosion management of an asset and preempt corrosion failures. Simultaneously, pertinent corrosion costs can be significantly optimized.

Failure Risk Assessment Costs

The only cost associated with FRA activities is the cost of carrying them out. Therefore, proper planning and ensuring that the FRA process is carried out using reliable input will optimize such activities and thus their pertinent costs.

Cost Optimization Misconceptions and Their Repercussions

The greatest corrosion cost misconception is to reduce a CE-based and/or non-CE-based integrity management measure without assessing the possible adverse effects it may have on the overall corrosion control program. That is, the integrity situation in the long term can actually deteriorate when downsizing or reducing the inspection scope, chemical injection rate, training budget, communication, etc., without carrying out any prior assessment to determine the effect of such reductions in size, number, rate, or budget. The fact is, in many observed cases, an instant decision is made to reduce a particular CE-based or non-CE-based integrity measure in a way to make a cost saving. However, such improper and superficial acts often lead to much greater corrosion costs in the long term.

Conclusions and Recommendations

Conclusions

Preempting corrosion failures would eliminate post-failure corrosion costs, thus significantly reducing the overall corrosion costs.

Due to the congruity between the concepts of corrosion management and corrosion cost optimization, proper implementation of the former can have a marked positive influence on the latter.

Recommendations

Beginning at the design stage, avoid both overdesign and underdesign in corrosion engineering as much as possible. Basing engineering decisions on accurately collected information is critical to achieving this objective.

Pay close attention to the management requirements (within the non-CE-based category). Proper and timely creation of such requirements, including their regular updating and maintenance, can significantly improve corrosion management implementation, and significantly optimize non-CE-based costs.

References

1. A. Morshed, The Evolution of the Corrosion Management Concept, MP 52, 8 (2013), p. 66

Guide Helps Estimate Cost and Service Life for Protective Coatings

By Materials Performance on 6/29/2017 3:23 PM

The guide’s purpose is to present a practical, easy-to-use document to identify, compare, and select protective coating systems that are cost-effective for specific environments.

To help coatings engineers or specifiers determine candidate protective coating systems for particular industrial environments, NACE International members Jason Helsel and Robert Lanterman developed a practical guide, “Expected Service Life and Cost Considerations for Maintenance and New Construction Protective Coating Work” (CORROSION 2016 paper no. 7422). This guide discusses commonly used generic coating systems and the service life for each in specific environments; current costs for materials and their application (both shop- and field-applied); and guidelines for calculating installed system costs. The authors comment that specific job costs will vary depending on the characteristics of a project, and note that the guide’s purpose is to present a practical, easy-to-use document to identify, compare, and select protective coating systems that are cost-effective for specific environments.

To identify the costs of surface preparation, coating application, and materials for typical industrial environments, as well as the available generic coatings used in those environments and the expected service lives of those coatings, a survey was implemented to collect information from major protective coatings manufacturers, steel fabricators, painting contractors, and end users. Cost data were developed from collected data as well as common industry cost references.

The authors use a “practical life” maintenance approach in the guide for projecting the life of the coating system, which estimates the service life as the number of years before first maintenance painting should begin—when the coating exhibits 5 to 10% breakdown and active rusting of the substrate is present—rather than the time until a coating system needs to be replaced.

Data tables in the guide for the estimated practical service life of coating systems include information such as generic coating types (i.e., acrylic, alkyd, epoxy, epoxy phenolic, epoxy zinc, organic zinc, inorganic zinc, metalizing, moisture curing polyurethane, and miscellaneous coatings); types of surface preparation—hand or power tool cleaning or abrasive blast cleaning; number of coats; and minimum dry film thickness (DFT) of the coating. Coating types are grouped into categories for either atmospheric exposure or immersion (water) service. Coating life-expectancy information corresponds to the corrosivity of the service environments. The harshness of atmospheric service is classified as C2 through C5 for mild, moderate, severe (heavy industrial), and seacoast heavy industrial, as defined in ISO 12944-2, “Classification of Environments.” The service environments corresponding to immersion service include potable, fresh, and salt water immersion.

Generally, the authors say, most users follow a maintenance painting sequence of spot touch-up and repair, then maintenance repaint (spot prime and full coat), and finally full repaint (total coating removal and replacement). They estimate the number of years for a practical maintenance sequence as follows: spot touch-up and repair at the practical life (P) of the coating system, maintenance repainting at the coating system’s practical life plus 33% (P x 1.33), and full repaint at the coating’s practical life plus 50% (P x 1.5).

Helsel and Lanterman emphasize that distribution of coating breakdown must also be taken into account when judging the costs and feasibility of maintenance painting. “For example, 5% breakdown that occurs in well-defined areas can be practically repaired through localized touch-up, whereas 5% breakdown uniformly scattered across 100% of the surface may be beyond practical spot repair,” they say.

Also, the authors point out that the practical maintenance sequence may not always represent the most economical approach to maintenance painting. The physical characteristics of the existing coating and the amount of corrosion present are the determining factors, and it may be possible to perform several touch-up and maintenance repainting cycles and push the time until full repainting is required. They note that the decision to conduct a maintenance repaint vs. a full repaint should be based on results of a coating investigation that assesses coating thickness, adhesion, substrate condition, and the extent and distribution of corrosion.

The guide also presents a data table with the estimated material cost per square foot for particular paints/protective coatings based on a typical DFT for that coating. Coatings listed include various acrylics, alkyds, epoxies, polyurethanes, siloxanes, zinc-rich coatings, and others.

Additionally, data tables are presented for non-material costs for shop painting and field painting, which include costs per square foot for surface preparation, application labor for various types of shop coatings (one-pack products, two-pack epoxies and urethanes, zinc-rich primers, and plural component spray) and field coatings (one-pack brush/roller and spray, two-pack spray epoxies and urethanes, spray zinc-rich primes, and plural component spray); equipment; and other related costs. The authors comment that the practical life of the coating and the cost of the repainting steps will vary depending upon whether the original coating was applied in the shop or in the field and provide an example of cost estimates for a typical maintenance painting sequence for both shop-applied and field-applied original coatings.

To compare the costs of one coating system to another, Helsel and Lanterman comment that the time table for maintenance painting, the number of maintenance painting cycles required to achieve the structure’s desired life, and the cost of these painting operations at current cost as well as net present value and net future value, should be noted. The guide provides several calculations to determine net present value and net future value, along with examples. With this information, the cost of a coating system for long-term protection over the structure’s life can be determined, which gives the user a comparable basis for selecting a coating system.

Soil-Side Corrosion Causes Premature Failure of Oil Storage Tank Bottom Plates

By Materials Performance on 6/29/2017 3:25 PM

Soil side of the failed plate sample.

Arefinery was experiencing bottom plate underside (soil-side) corrosion of its aboveground storage tanks (ASTs) at an extraordinarily high rate of 1 to 2 mm/y, which resulted in the failure of four tanks within a two-year period that occurred seven years after the refinery was commissioned. All four tanks had severely damaged bottom plates, which were constructed of 8-mm thick uncoated carbon steel.

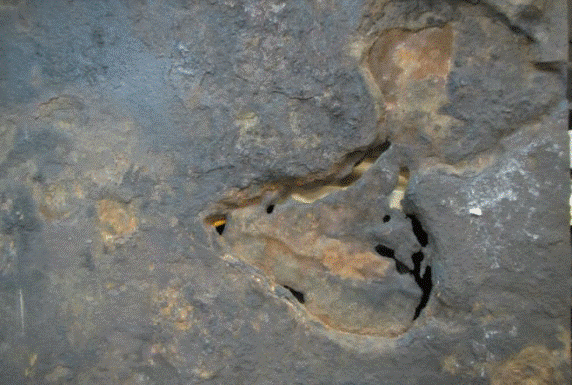
Underside corrosion protection for the ASTs was provided by an impressed current cathodic protection (ICCP) system using a mixed-metal oxide (MMO) grid anode system. The corrosion morphology after the failure revealed severe localized corrosion with large, deep pits found under deposits of orange-red tubercles comprised of iron oxides.

In CORROSION 2017 paper no. 9025, “Premature Failure of API 650 Oil Storage Tank Bottom Plates Due to Soil Side Corrosion,” authors N. Al Abri, J.R Nair, A. Al Ghafri, and F. Al Mawali describe the failure analysis carried out, which included a review of the design and function of the CP system and metallurgical tests of a failed bottom plate sample.

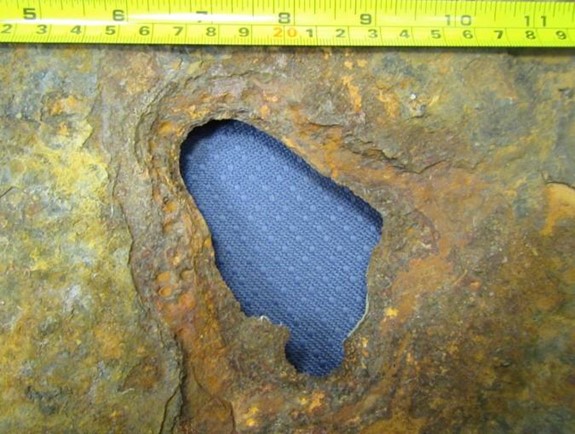
A 100-by-100 mm hole was observed when layers of metal were removed from the sample’s soil side.

A 100-by-100 mm hole was observed when layers of metal were removed from the sample’s soil side.

For the ICCP system, the MMO anode grid was placed between a high-density polyethylene (HDPE) secondary containment liner and the tank bottom, which sat on a 75-mm thick sand pad. The underside of the bottom plates was uncoated and the CP design was based on 100% bare surface area.

The failures occurred between July 2013 and August 2015, and a detailed CP survey was carried out for the storage tanks in February 2016. The results revealed that none of the tanks achieved the NACE SP0193-20161 protection criterion of –850 mV instant “off” potential. The potentials varied from –200 to –800 mV vs. a copper/copper sulfate (Cu/CuSO4) electrode (CSE), with an average “off” potential of –450 mV vs. CSE across all tanks.

Since the potentials were not meeting the –850 mV criteria, further investigation was done to understand the possible reasons for such low polarized potentials. The authors note that design deficiencies of the ICCP system—primarily the anode depth/spacing and inappropriate distribution of power feed cables—resulted in a nonuniform potential profile across the tank bottom surface. High current and voltage attenuation along the anode grid did not provide sufficient current and polarization at a distance away from the power feeds, which led to under-protection of the tank bottom.

Because an inefficient CP system alone typically doesn’t cause such aggravated corrosion, a sample from the failed tank bottom was sent to an external laboratory for a detailed metallurgical analysis to identify corrosion products and possible corrosion mechanisms. A form of underdeposit corrosion (UDC) that can corrode steel at the rate of 1 mm/year is microbiologically influenced corrosion (MIC).

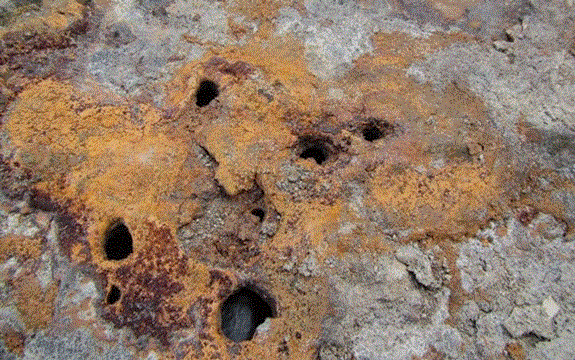
Multiple perforations were seen under the corrosion deposits.

Multiple perforations were seen under the corrosion deposits.

X-ray diffraction analysis of the sample plates’ soil side indicated the tubercles were made of porous layers or strata consisting mainly of iron oxides surrounded by magnetite (Fe3O4). The scales appeared to consist of multiple layers. A closer analysis performed on flakes from scale on the pits indicated the probability of iron-oxidizing bacteria (IOB) present in the corrosion, which formed deposits that further aggravated the corrosion by forming a differential aeration cell. IOB produce orange-red tubercles of iron oxides and hydroxides by oxidizing ferrous ions from the bulk medium or the substratum.2

The corrosion rates observed were amplified by the ingress of water, primarily from leaking fire water sprinklers, through gaps between the annular plate and foundation, which brought in bacteria and corrosive anions such as chlorides and sulfates. Without an effective CP system and no other means of corrosion control, the tank floor was exposed to a severe form of bacterial and UDC that led to perforation and loss of inventory.

References

1 NACE SP0193-2016 (formerly RP0193-2001), “External Cathodic Protection of On-Grade Carbon Steel Storage Tank Bottoms” (Houston, TX: NACE, 2016).

2 A.W. Peabody, Peabody’s Control of Pipeline Corrosion, 2nd ed., R. Bianchetti, ed. (Houston, TX: NACE International, 2001), p. 279-280.

Fluoride Corrosivity on Mild Steel in Cooling Systems

By Alfonso Palazzo on 6/29/2017 3:24 PM

The utilization of substandard water to open recirculating cooling water systems can often render these complex systems susceptible to increased fouling and corrosion.

Editor’s note: Learn more about the impact of fluoride on mild steel in this Materials Performance quarterly special feature, “The Science Behind It.” After you read the MParticle about the study on corrosion effects of fluoride-containing brackish water in steel mills, explore the science behind the corrosion problem, which is presented in several related CORROSION articles listed at the end of the article.

In their pursuit of zero effluent discharge, industrial plants are reducing fresh water intake and limiting the volume of water released back into the environment. Because of this and the cascading reuse of water, industry is often forced to utilize inferior water quality for lower risk applications. The utilization of substandard water as makeup water to open recirculating cooling water systems can often render these complex water systems susceptible to increased fouling and corrosion. This can severely hamper production, threaten both plant and process integrity, and ultimately add to the company’s cost and risk of doing business.

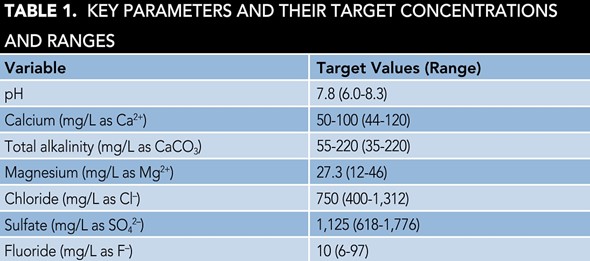
Waterborne constituents responsible for fouling or corrosion may be either microbiological or chemical in nature. When an available water source is considered brackish, as it was for a southern African steel mill, the water conductivities range from 2,500 to as high as 5,000 µS/cm1 with the principle anions being chloride (200 to 800 mg/L), sulfate (400 to 1,000 mg/L), and varying levels of fluoride (2 to 100 mg/L). In steel mills, fluorspar (the mineral form of calcium fluoride [CaF2]) has been used for centuries as a flux for ores and is the primary reason for the high levels of fluoride in their water systems.

Early work done to better understand and predict the corrosivity of water to mild steel extends back to Tillmans and Heublein2 and Langelier.3 Some of the indexes that have gained acceptance in the chemical industry worldwide, including those inadvertently used to predict corrosion, are the Langelier saturation index (LSI),3 Ryznar stability index (RSI),4 Puckorius or practical scaling index,5 Larson-Skold index or ratio,6 and the more recent eight-variable empirical model constructed by Pisigan and Singley.7 The former indexes were designed primarily for the drinking water industry and were mostly indicative of the tendency of a surface water to precipitate calcium carbonate (CaCO3) rather than predict the absolute corrosivity of specific waters. It has been stated that the LSI has no correlation with corrosion rate;8 and it was suggested that use of the LSI for corrosion prediction should be abandoned based on empirical evidence.9 The same sentiment applies to the RSI and the various “corrosion prediction indexes” that emerged during this period, which were also grounded on the same principle.

A key parameter relevant to the steel mill’s brackish water is the fluoride concentration. Although various authors have studied the corrosivity of fluoride and there is ample evidence of its impact on mild steel,10-12 additional research was necessary to be able to predict the corrosivity of fluoride in fresh and brackish water. The purpose of this study was to develop mathematical models of the impact of fluoride on mild steel in brackish water at temperatures typical of industrial cooling water.

Experimental Procedure

Field Work

Before starting the laboratory evaluations, it was necessary to collate and analyze on-site laboratory data from the steel manufacturer’s two open recirculating cooling water systems. The data were used to establish the operating ranges of the key water chemistry parameters being monitored, and determine the low-carbon mild steel (C1010) coupon corrosion rates. The coupons were similar to piping metallurgy API 5L Gr B and SABS 719 Gr A. ASTM standard D2688-9013 was followed in terms of the design, installation, and operation of the bypass specimen test rack installed on the hot water return to the cooling towers. The fluid velocity was maintained at ~1.5 m/s and the coupons were exposed for 30 days. The coupon cleaning method followed ASTM standard G1-90.14

Two licensed software programs were used during the evaluations to predict the various saturation and engineering indexes, and compile statistics. The data were collated from March 3, 2009 to March 25, 2011. A detailed list of the equipment—as well as a detailed list of the analytical equipment, laboratory reagents, and consumables—are outlined in Reference 1.

Laboratory Work

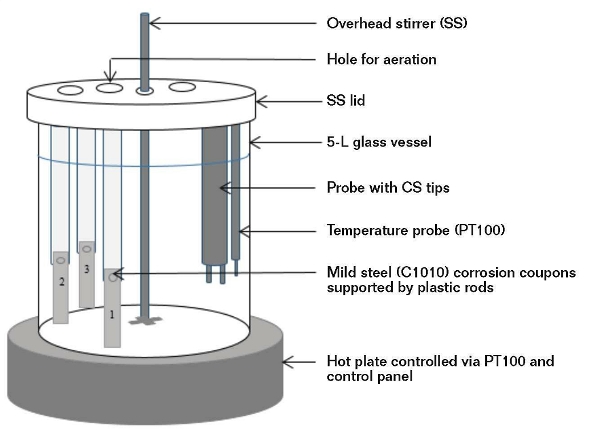
Figure 1 shows the corrosion test setup and Table 1 lists the key water parameters. The limiting condition for the applicability of this study is that the water must have a quality image as defined in Table 1.

FIGURE 1: Schematic diagram of laboratory scale and corrosion test station.

FIGURE 1: Schematic diagram of laboratory scale and corrosion test station.

The laboratory corrosion tests were performed in two rounds. In the initial round, the tests were performed per classical design by varying a single parameter at a time while maintaining the other parameters as constants. In the second round of tests, a fractional factorial design approach was adopted and statistical software was used to perform the exercise. The parameter values were all varied for each run and the combined effect of varying all the parameters provided a wider range of water chemistries than the classical design.

In both rounds, C1010 corrosion coupons were subjected to synthetic test solutions (4,000 mL). The tests were all conducted at 45 °C over a period of 72 h. The contents of the vessel were stirred at 100 to 110 rpm to produce a linear velocity of 1.5 m/s at the coupon surface. In the classical design round, each test contained two coupons and was performed in triplicate. In the factorial design experiment, each vessel contained three corrosion coupons.

The coupons were removed, cleaned, and weighed, and the corrosion rates calculated based on their weight loss in accordance with ASTM methods G1-90 and G31-72.15 The corrosivities of the corrosion test solutions were determined by using the direct weight technique on the C1010 corrosion coupons.

At the start of the test, 1 L of each test solution was removed and submitted for laboratory analyses. Upon ending the 72-h corrosion tests, additional test solution samples were submitted for the same analyses.

Results

Field Results

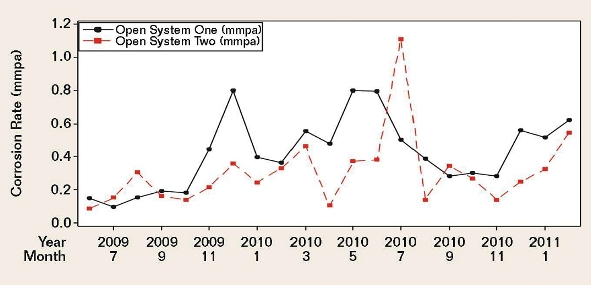
Figure 2 demonstrates moderately positive correlations between the corrosion rates of the two systems.

FIGURE 2: Time series plot of CWS 1 and CWS 2 monthly coupon corrosion rates.<sup>1</sup>

FIGURE 2: Time series plot of CWS 1 and CWS 2 monthly coupon corrosion rates.1

Although cooling water system one (CWS 1) and cooling water system two (CWS 2) received the same brackish makeup water, there were significant differences in their operating conditions and chemical treatment, namely the system volumes; operating temperatures; cycles-of-concentration; side-stream sand filter efficiencies; and, most importantly, the oil removal rates.Due to numerous unaccounted-for factors that could have potentially affected the coupon corrosion rates, it was virtually impossible to arrive at any statistically significant correlations between each individually monitored water chemistry parameter and the coupon corrosion data. This was evident for both cooling water systems over a period of 20 months. Many of the literature-derived indexes mentioned previously were also applied to the two systems, but the results lacked meaningful, statistically significant correlations.

Since this exercise proved largely futile at identifying the key factors responsible for the mild steel corrosion, it was necessary to conduct a laboratory investigation of the possible combined effects and interdependency of the various factors.

Laboratory Results

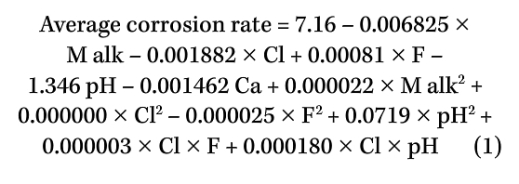
Extensive laboratory data captured from classical and factorial design experiments performed at 45 °C were analyzed using the statistical software, and the results were used to derive a multiple regression for the average corrosion rate (mmpa) (with an R2 of 81%1) using Equation (1):

Equation 1

Equation 1

where chloride (Cl) and fluoride (F) are measured as mg/L, and total alkalinity (M alk) is measured as mg/L of CaCO3.

A comparison of this brackish water model (BWM) with the previously evaluated indexes for CWS 1 cooling water revealed significantly improved accuracy of the new model over the four indexes.

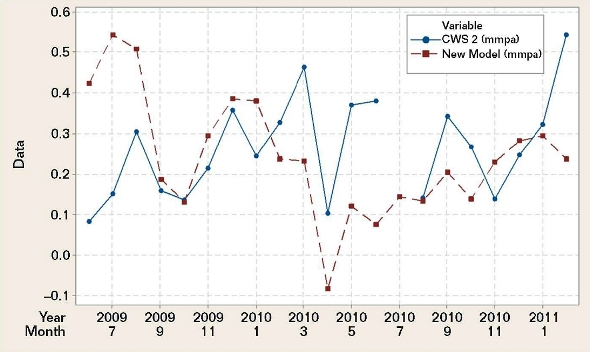
FIGURE 3: Time series plots of the BWM-based mild steel corrosion rate predicted for CWS 2 using CWS 2 water makeup chemistry vs. the plant CWS 2 mild steel corrosion rates measured with coupons in the field.

FIGURE 3: Time series plots of the BWM-based mild steel corrosion rate predicted for CWS 2 using CWS 2 water makeup chemistry vs. the plant CWS 2 mild steel corrosion rates measured with coupons in the field.

Figure 3 shows the plotted CWS 2 field coupon corrosion rates vs. the mild steel corrosion rates calculated with the BWM and the water chemistry data for CWS 2. The plots are weakly correlated (r = –0.104) and lack statistical significance (p = 0.673).1 A time series plot instead of a scatterplot was used to demonstrate this lack of correlation. It revealed the chronological positions of the discrepancies between the CWS 2 field data and the new model BWM data.When CWS 2 water chemistry data were replaced with CWS 1 water chemistry data, it was found that the calculated corrosion rates were statistically significant when correlated with the CWS 2 field coupon-derived corrosion rates (p value <0.0001 and r value = 0.742). As the two cooling systems utilize the same makeup water, they were not expected to have yielded such diverse results. Upon closer scrutiny of the CWS 2 water chemistry data for factors that may have impacted the systems, it was found that phosphate had been excluded from the BWM. A greater impact due to fluoride was incorporated into the model, so that a modified BWM (an R2 of 85%) using Equation (2) was used:

Equation 2

Equation 2

where fluoride (F) and phosphate (PO4) are measured in mg/L.

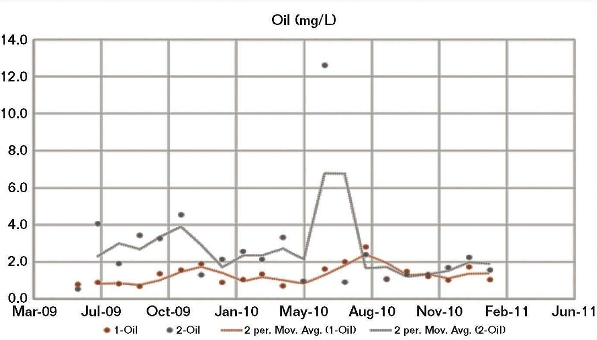
FIGURE 4: A comparison of the oil content for CWS 1 vs. CWS 2 shows a spike in June 2010 for CWS 2.

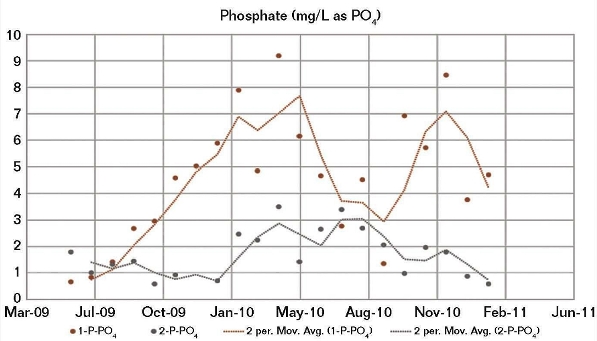
FIGURE 5: A comparison of the phosphate content in CWS 1 vs. CWS 2 shows generally higher levels for CWS 1.
The good correlation between both the CWS 1 and CWS 2 field corrosion data and the BWM corrosion results calculated using the CWS 1 water chemistry, and the fact that a modified BWM had to be developed to achieve a good correlation between the CWS 2 corrosion and its water chemistry, indicated a possible irregularity in the CWS 2 water chemistry data. Although the two cooling water systems received the same brackish makeup water, there were significant differences in their operating conditions, particularly the oil removal rates. Generally, the amount of oil present in CWS 2 (Figure 4) was higher than for CWS 1, whereas the opposite was generally apparent for phosphate (Figure 5) and fluoride.

Conclusions

The empirically derived prediction model for mild steel corrosion in brackish water—BWM—predicted with reasonable accuracy the CWS 1 corrosion, as shown by the statistically strong correlation (r = 0.92) with the actual plant mild steel coupon data and the linear fit with an R2 of 87%. The application of the BWM to CWS 2 was totally inadequate. An examination of the factors initially excluded from the BWM (phosphate, fluoride, and oil concentrations) revealed that the inclusion of phosphate and fluoride resulted in a modified equation with an R2 of 85%. Mill process contaminants such as oil were therefore deemed responsible for the inaccuracy of the BWM using the CSW 2 water chemistry.

Acknowledgments

The author is thankful to Buckman Africa (Pty), Ltd. for providing the necessary funding and the use of its laboratories, and to Dr. J. van der Merwe of the University of the Witwatersrand and Mr. G. Combrink of the University of Johannesburg for their technical support.

References

1 A. Palazzo, “The Impact of Fluoride on the Corrosivity of Brackish Water on Mild Steel in Industrial Cooling Systems” (Ph.D. thesis, University of the Witwatersrand, Johannesburg, 2015).

2 J. Tillmans, O. Heublein, “Investigation of the Carbon Dioxide which Attacks Calcium Carbonate in Natural Waters,” Gesundheits Ingenieur 35, 34, (1912): pp. 669-677.

3 W.F. Langelier, “The Analytical Control of Anti-Corrosion Water Treatment,” J. AWWA28, 10 (1936): pp. 1,500-1,521.

4 J.W. Ryznar, “A New Index for Determining the Amount of Calcium Carbonate Scale Formed by a Water,” J. AWWA 36, 4 (1944): pp. 472-475.

5 P.R. Puckorius, J.M. Brooke, “A New Practical Index for Calcium Carbonate Scale Prediction in Cooling Tower Systems,” Corrosion 90, 99 (1990).

6 T.E. Larson, R.V. Skold, “Corrosion and Tuberculation of Cast Iron,” J. AWWA 49, 10 (1957): pp. 1,294-1,302.

7 R.A. Pisigan, J. E. Singley, “Evaluation of the Corrosivity Using the Langelier Index and relative Corrosion Rate Models,” Corrosion 84, 149 (1984).

8 D.L. Piron, et al., “Corrosion Rate of Cast Iron and Copper Pipe by Drinking Water,” Corrosion Monitoring in Industrial Plants Using Nondestructive Testing and Electrochemical Methods, G.C. Morgan and P. Labine, eds. (West Conshohocken, PA: ASTM, 1986).

9 “Internal Corrosion of Water Distribution Systems, 2nd ed. A Cooperative Research Report,” AWWA, #725, 1996, pp. 29-70.

10 V.D. Moll, et al., “The Kinetics and Mechanism of the Localized Corrosion of Mild Steel in Neutral Phosphate-borate Buffer Containing Sodium Fluoride,” Corros. Sci. 25, 4 (1985): 239-252.

11 A. Macias, M.L. Escudero, “The Effect of Fluoride on Corrosion of Reinforcing Steel in Alkaline Solutions,” Corros. Sci. 36, 12 (1994): 2,169-2,180.

12 J.J. Dillon, G.B. Waltman, “The Effect of Mold Powders on Corrosion of Continuous Caster Components,” Corrosion 95, 499 (1995): pp. 1-25.

13 ASTM D2688, “Standard Methods for Corrosivity of Water in the Absence of Heat Transfer (Weight Loss Methods)” (West Conshohocken, PA: ASTM, 2015).

14 ASTM G1, “Standard Practice for Preparing, Cleaning, and Evaluating Corrosion Test Specimens” (West Conshohocken, PA: ASTM, 2011).

15 ASTM G31, “Standard Practice for Laboratory Immersion Corrosion Testing of Metals” (West Conshohocken, PA: ASTM, 2012).

Cathodic Protection: Industrial Solutions for Protecting Against Corrosion

Cathodic Protection: Industrial Solutions for Protecting Against Corrosion

By Volkan Cicek (360 pages)

Price USD 175 (RM 750 – This book is available in the PSZ library TA418.74 C53)

A companion to the title Corrosion Chemistry, this volume covers both the theoretical aspects of cathodic protection and the practical applications of the technology, including the most cutting-edge process and theories. Engineers and scientists across a wide range of disciplines and industries will find this the most-up-to-date, comprehensive treatment of cathodic protection available. A superb reference and refresher on the chemistry and uses of the technology for engineers in the field, the book also provides a tremendous introduction to the science for new comers to the field


Corrosion Engineering Handbook

Corrosion Engineering Handbook, Second Edition

By Philip A. Schweitzer ( 1,400 pages – quite a mouthful to read this book)

Price USD 260 ( RM 1118 – Oi very expensive book but no worry staff and student at UTM Skudai can get hold of this book at PSZ library – TA 462 S34)

Nearly twice the size of its first edition, this book has been updated and expanded into a set of three self-contained volumes. Each book is focused on a specific area of corrosion science and technology: Fundamentals of Metallic Corrosion; Corrosion of Polymers and Elastomer; and Corrosion of Linings and Coatings. The handbook examines all aspects necessary for understanding and mitigating potential corrosion problems. It covers mechanisms of corrosion and corrosion-resistant properties of various materials. It also contains detailed coverage of proper fabrication and installation techniques, methods for preventing corrosion, and techniques for testing and monitoring corrosion and processing conditions.