Anticorrosion properties of epoxy-nanochitosan nanocomposite coatings

Taken from – http://www.european-coatings.com/Raw-materials-technologies/Applications/Protective-Marine-coatings/Anticorrosion-properties-of-epoxy-nanochitosan-nanocomposite-coatings

Tuesday, 24 October 2017

Nanochitosan was prepared to act as a nanofiller reinforcing agent that had been incorporated in a protective coating for corrosion protection using high-molecular-weight chitosan.

Anticorrosion properties of epoxy-nanochitosan nanocomposite coatings. Source: Pixabay

Source: Pixabay

A series of epoxy resin based nanocomposite coatings were prepared with various of nanochitosan (NCH) loading ratio and applied on mild steel substrates under ambient conditions.

Characterisation methods

The surface morphology and structural characterisation of the NCH and nanocomposite coatings were carried out using Field Emission Scanning Electron Microscope (FESEM), X-ray diffraction (XRD), and Fourier transform infrared (FTIR) spectroscopy. Optical characterisation of the nanocomposite specimens was examined by UV-vis spectroscopy at a range of 300-800 nm in transmission mode. The thermal analysis was employed using differential scanning calorimetry (DSC) and thermogravimetric analysis (TGA). The corrosion protection performances of the nanocomposite coated mild steel substrates were comparatively studied using electrochemical impedance spectroscopy (EIS).

Enhanced anticorrosion properties

The results showed that all the epoxy resin based nanocomposite coating containing NCH significantly increases the anticorrosion properties. The incorporation of 0.5% nanochitosan exhibited the overall best performance.

The study is published in: Progress in Organic Coatings, Volume 113, December 2017


Coupons for Cathodic Protection Evaluation of Mixed-Metal Piping Systems

Coupons can be used to assist in the evaluation of CP levels in buried steel piping.
 Editor’s note: Learn more cathodic protection (CP) for steel structures buried in soil in this Materials Performance quarterly special feature, “The Science Behind It.” Once you’ve read the MP article on mixed-metal circuits, explore the science behind the corrosion problem, which is presented in several related CORROSION articles listed at the end of the article.

The measurement and interpretation of cathodic protection (CP) data in plants or other complex facilities present inherent challenges where mixed metals are electrically continuous within the protected structures’ CP system. Often there is no attempt to electrically isolate the buried steel piping networks from other metals in the facility for safety and practical considerations. Coupons can be used to assist in the evaluation of CP levels on buried steel piping in mixed-metal circuits; however, the present industry practice of disconnecting the coupon from the mixed-metal circuit to measure the potential and polarization, without other considerations, raises concerns because the instant disconnect condition may not be a true representation of the protection status.

Although coupon usage has long been recognized as a valuable tool for evaluating CP conditions on buried piping systems, their use in plants and other complex facilities can increase confusion and raise additional questions on the CP status. Plant facilities frequently include extensive buried networks of bare conductors, including copper, steel-in-concrete, mixed-metal circuits, different fill materials, and protected buried structures that are within the influence of closely coupled impressed current anodes. These and other factors present inherent challenges with regard to CP measurements and the interpretation of data.

Depending on the complexity and nature of the facility and equipment, establishing and maintaining electrical isolation can be impractical on networks of steel piping systems within plants. Safety and practical considerations are the key reasons for avoiding electrical isolation devices in classified areas, including the possibility for arcing, reducing touch voltage hazards, and minimizing the propensity for CP downtime, since the failure of a single isolation device in a system can result in complete loss of protection. In critical double containment piping systems, where fabrication requires 100% welded construction, mechanical fittings often are not permitted. In these situations, the CP system is designed to account for the mixed-metal circuit, often using closely coupled impressed current anodes that are distributed throughout the piping network.

When coupons are used in this type of system, the coupon is also within the zone of influence of the anode gradients. Coupon size and placement are critical for collecting meaningful data. The coupon size is selected to match the surface area of a typical coating holiday that is anticipated at a specific location, and proper coupon placement can reduce voltage drop errors. It is also important that the coupon be exposed to the same local environment (including any select fill or controlled density fill) that is in contact with the pipe steel at coating holiday(s). Accordingly, it is essential to collect data at sufficient locations so they are representative of conditions throughout the facility.

Coupons are commonly used when the CP current sources cannot be interrupted; thus, the “current applied—coupon disconnected” (Vc-a-d) is frequently the accepted measurement. However, the voltage drop (sometimes called IR drop) in the measurement can be significant when the coupon is located within the gradient of closely coupled anode systems. Further, the disconnected coupon potential may not be representative of the normal piping condition in a mixed-metal circuit. When it is possible to interrupt the impressed current CP sources for buried piping, coupon “on” and “off” potentials can be measured while connected and disconnected.

The literature on coupons is extensive; however, many questions arise on their proper use when evaluating the CP status of buried piping in a mixed-metal circuit:

• Is the coupon instant-disconnect potential measurement an accurate representation?

• How can the 100 mV polarization CP criterion be used to satisfy NACE International SP0169-2013?1

• Is it appropriate to leave the CP system energized during the coupon instant-disconnect potential measurement?

• How can coupon current measurements be used to evaluate CP status?

• Are other CP criteria appropriate for the location?

Instant-Disconnect Potential Measurements

NACE SP0104-2014,2 Section 3.11, discusses the use of coupons in complex piping environments where mixed metals are electrically continuous with the protected piping. NACE Publication 352013 also addresses the use of coupons in detail, stating that the application of polarized potential or polarization criteria is not always technically correct, and during current interruption, secondary voltage drops from circulating galvanic currents can cause errors in the measurements on structures with characteristic potentials that can vary widely. A suggested approach is to acquire these measurements while locally disconnecting the coupon from the structure. The question remains whether the disconnected coupon’s potential measurement is a true representation of the actual mixed-metal circuit condition.

Simultaneous interruption of all connections between the carbon steel (CS) piping and the bare copper grounding conductors (not a realistic concept) would not be a valid representation of the CS piping condition when in the mixed-metal circuit. The pipe-to-soil potential would be expected to become more negative when the more noble metal (i.e., copper) is disconnected. Depending on the level of polarization of the mixed-metal circuit, similar behavior can be seen on a coupon when it is disconnected.

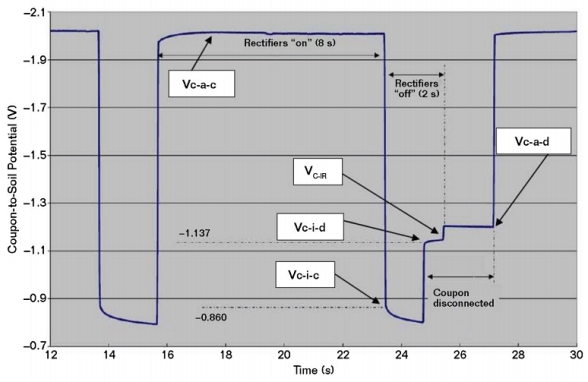
Figure 1 is a plot of coupon-to-soil potentials in a mixed-metal circuit that includes bare copper grounding conductors and a closely coupled anode system. These potentials were measured with the rectifiers cycling on and off, and with the coupon connected and disconnected during the cycle. It includes four coupon-to-electrolyte potentials, as described in NACE SP0104-2014:

• Current applied—coupon connected (Vc-a-c)

• Current applied—coupon disconnected (Vc-a-d)

• Current interrupted—coupon connected (Vc-i-c)

• Current interrupted—coupon disconnected (Vc-i-d)

Figure 1 Coupon-to-soil potentials (vs. CSE) in a mixed-metal circuit.

Figure 1 Coupon-to-soil potentials (vs. CSE) in a mixed-metal circuit.

As shown in Figure 1, the potential of a CS coupon can become more negative when it is disconnected from CS piping that remains connected to bare copper. When this behavior is observed, it suggests a greater accuracy concern as compared to the impact of secondary voltage drops from circulating currents during CP current interruption. The Vc-i-c potential represents the coupon’s mixed-metal circuit polarized potential and is considered to be a necessary measurement for CP evaluation. The current applied and interrupted instant-disconnect potentials are also considered to be required measurements. The native and disconnected depolarized potentials are also important.

100 mV Criterion

In complex facilities, the use of alternate protection criteria may be advantageous, including the 100 mV polarization criterion. Correct interpretation in mixed-metal circuits, however, is critical. Simply measuring depolarization from the mixed-metal polarized potential could result in an improper conclusion that CP is effective if this is 100 mV or more. Would this indicate protection if the mixed metal polarized potential is more positive than the open-circuit potential (OCP) of the CS pipe? For example, if the mixed-metal polarized potential is –450 mV in a copper/copper sulfate reference electrode (CSE) and the mixed-metal depolarized potential is –350 mV vs. CSE, can it be concluded that the CS is protected if its OCP is more negative than –450 mV vs. CSE?4

NACE SP0169-2013, Section 6.3.4, states, “In mixed-metal piping systems, CP can be typically achieved at a polarized potential that is 100 mV more negative than the OCP of the most active metal.” Coupons can be used to meet the intent of this standard by showing that the coupon’s mixed-metal polarized potential is 100 mV more negative than the OCP of the coupon.

NACE/ASTM G193-12D5 defines OCP as the corrosion potential—the potential of a corroding surface in an electrolyte measured under open-circuit conditions relative to a reference electrode (also known as electrochemical corrosion potential, free corrosion potential, and OCP). Typically, native potentials are not measured on buried steel piping in plants prior to mechanical completion. Where electrical isolation is not established, native potentials measured after mechanical completion and prior to applying CP are representative of the mixed-metal native state and are not considered to be the OCP of the most active metal. However, a native potential on a coupon can be measured before it is connected to the mixed-metal circuit (after sufficient aging and before initial CP is applied). Upon the application of CP, this measurement provides a baseline to reference the degree of cathodic polarization of the mixed-metal circuit.

After CP has been applied, the depolarized potential often differs from the initial native coupon potential. Subsequent evaluations can identify whether the disconnected coupon depolarizes 100 mV or more positive than the coupon’s mixed-metal polarized potential; or, by allowing the coupon to fully depolarize, reestablish its OCP for comparison to the coupon’s mixed-metal polarized potential. If the fully depolarized disconnected coupon potential is desired, the CP system may have to be de-energized for a prolonged time period where coupons are in the zone of influence of closely coupled anodes. The CP system for CS piping in mixed-metallic circuits as described here should continue to be energized to the greatest extent possible to avoid accelerated corrosion at coating defects on the piping because of the galvanic couple to a massive cathode (i.e., bare copper grounding network).

Voltage Drop

The reference electrode should be located as close to the coupon as is practical, as described in NACE SP0104-2014, to minimize voltage drop error in the potential measurements. A coupon within the zone of influence of an energized anode, as is the case with closely coupled anodes, can show influence from the CP system regardless of whether the coupon is connected or disconnected. SP0104-2014 recognizes that current-applied coupon potential measurements can include voltage drop error. In this standard, “Appendix D, Coupon IR-Drop Calculation Procedure” provides a method to identify voltage drop error.

The most common measurements are Vc-a-c and Vc-a-d. According to NACE SP0104-2014, in mixed-metal circuits, and where the voltage drop may be significant, Vc-i-c and Vc-i-d also should be measured. The difference between Vc-a-d and Vc-i-d is the coupon voltage drop (Vc-IR).

Potential Measurement Evaluation

In Figure 1, Vc-a-d and Vc-i-d are more negative than the Vc-i-c (i.e., the mixed-metal polarized potential). In this case, Vc-i-d is 277 mV more negative than Vc-i-c and, therefore, not considered an accurate representation of the CS condition in the mixed-metal circuit. The same concern applies for the Vc-a-d measurement. Vc-IR is ~–50 mV, which represents the voltage drop error in the Vc-a-d measurement. In Figure 1, Vc-i-c satisfies the polarized –850 mV CP criterion. However, if Vc-i-c was more positive than –850 mV vs. CSE, the 100 mV criterion can be evaluated by comparing Vc-i-c to the OCP of the coupon. The coupon’s native potential that was established before it was connected to the mixed-metal circuit can be referenced as the OCP for evaluating the degree of polarization during the initial application of CP. While this value also could be used for subsequent evaluations in the mixed-metal circuit case, it is recognized that the depolarized potential can differ from the native potential after CP has been applied. Using the native potential is usually preferable to de-energizing the CP system for a long duration that is sometimes necessary to measure the fully depolarized potential.

Coupon Current

A shunt with a known resistance can be installed in series with a coupon to determine the current magnitude and direction. With the CP system energized, direct current (DC) pickup can provide an important indication of CP effectiveness at that location. Protective current density can be estimated from the surface area of the coupon, however, in mixed-metal circuits with the attempt to satisfy the –850 mV CSE polarized criterion, the observed current densities can be orders of magnitude greater than typical design CP current densities for bare CS. Current discharge from a coupon is an indication that protection is lacking and corrosion may be occurring at that location.

An indication of current pickup during the “off” portion of the rectifier cycle does not necessarily imply that CP is effective, as circulating currents can imply corrosion on the piping at other locations. Currents measured during the off cycle also confirm the caution in NACE SP0104-2014. The difference between the “on” and “off” mV drops across the shunt determines the net current on the coupon. The polarities are important to note in these measurements, as they indicate the direction of current flow.

Conclusions

Coupon size, placement, and environment must be carefully considered to provide data that are representative of structural conditions at a variety of locations throughout a facility.

In mixed-metal circuits, the coupon’s instant-disconnect potential alone might not be representative of the actual mixed-metal condition.

The Vc-i-c potential is considered a required measurement to evaluate protection status in mixed-metal circuits. Measurements should be obtained with the coupon connected and disconnected, and with the current applied and interrupted. Voltage drops can be present in the Vc-a-d measurements, especially in the case of closely coupled anode systems that are common in plants.

The 100 mV CP criterion in mixed-metal circuits, referenced from the Vc-i-c potential and the OCP of the CP coupon, meets the intent of NACE SP0169-2013, Section 6.3.4.

CP response can differ in soils vs. areas backfilled with controlled density fill where longer polarization and depolarization durations may be observed.

CP current pickup during the Vc-a-c condition can suggest effective protection at that location, assuming no sources of foreign interference currents are present.

Coupons should be allowed to age until stable native potentials have been established. Coupons should not be connected to the mixed-metal circuit until their native potential is established, and then only when the CP system is ready to be energized.

Acknowledgments

Acknowledgement is given to my colleagues within the Bechtel organization who provided contributions to this article, especially M. Fang, H. Acuna, and D. Chew.

References

1 NACE SP0169-2013, “Control of External Corrosion on Underground or Submerged Metallic Piping Systems” (Houston, TX: NACE International, 2013).

2 NACE SP0104-2014, “The Use of Coupons for Cathodic Protection Monitoring Applications” (Houston, TX: NACE, 2014).

3 NACE Publication 35201, “Technical Report on the Application and Interpretation of Data from External Coupons Used in the Evaluation of Cathodically Protected Metallic Structures” (Houston, TX: NACE, 2001).

4 W.B. Holtsbaum, “Application and Misapplication of the 100 mV Criterion for Cathodic Protection,” MP 42, 1 (2003): p. 30.

5 NACE/ASTM G193-12D, “Standard Terminology and Acronyms Relating to Corrosion” (Houston, TX: NACE, 2013).

This article is based on CORROSION 2017 paper no. 8824, presented in New Orleans, Louisiana, USA.

CorrCompilation: Corrosion Control by Organic Coatings

37620

CorrCompilation: Corrosion Control by Organic Coatings
By Robert Pogue

Price: $ 140

Get it here – https://store.nace.org/corrcompilation-corrosion-control-by-organic-coatings


Understand the use of coatings for the production of steel substrates to be used in the infrastructure, power generation, utilities, transportation, and manufacturing sectors. The title educates the reader on the use of organic coatings in corrosion prevention and tools for identification and remediation of coating failures in order to reduce the incidence of corrosion and its associated costs.

This compilation covers a broad range of applications and technologies to illustrate the use of coatings for the production of steel substrates. The papers were selected from those submitted to the NACE Corrosion Conferences from 2010 to 2016. They represent several different sectors including infrastructure, power generation, utilities, transportation and manufacturing and were written by authors from across the globe. The goal of this compilation is to educate the reader on the use of organic coatings in corrosion prevention and tools for identification and remediation of coating failures in order to reduce the incidence of corrosion and its associated costs.

The papers have been gathered into three sections; “Coatings and Coating Selection”, “Monitoring and Testing” and “Surface Preparation” to aid the reader in specifying, monitoring, and maintaining organic coatings for corrosion protection.

2017 by NACE, 552 pages, spiral bound, 8.5″ x 11″.

Mitigating corrosion and biofouling with nanofillers

Monday, 9 October 2017

The capability to improve the performance of polymer coatings with the inclusion of nanomaterials is a vital factor for mitigating corrosion and biofouling. Researchers have used nanocomposites as fillers for epoxy coatings to protect steel against corrosion and bacterial growth.

Mitigating corrosion and biofouling with nanofillers. Source: Pixabay

Mitigating corrosion and biofouling with nanofillers. Source: Pixabay

A novel TiO2-CuO nanocomposite was synthesised using oxalate method and the composite was characterised for its phase composition and morphology using different techniques.

Strong antimicrobial activity

Surface characterisation revealed the shape and uniform distribution of CuO and TiO2 nanoparticles. The results of electrochemical measurements conducted in 3.5% NaCl solution exhibited enhanced corrosion-protective properties of epoxy coatings with synthesised TiO2-CuO nanocomposites compared with the pure epoxy coating. In addition, the coated mild steel substrates showed that the nanocomposite coatings presented strong antimicrobial activity against Escherichia coli.

The study is published in: Progress in Organic Coatings, Volume 114, January 2018, Pages 9-18.

Fitz’s Atlas 2 of Coating Defects

38335

Fitz’s Atlas 2 of Coating Defects
By Brenda Fitzsimons

Price: $243

Get it here – https://store.nace.org/fitz-s-atlas-2-of-coating-defects


This pocket-sized ring binder includes more than 190 illustrations to provide the most comprehensive visual guide to coating and surface defects. Each section has been compiled by coating specialists who understand paint coatings and their application and as such will provide a useful pictorial reference to all who use and encounter paint coatings, their defects and failures.

Pipeline Coatings

37616

Pipeline Coatings
By Y. Frank Chang and
Richard Norsworthy

Price: $120

Get it here: https://store.nace.org/pipeline-coatings


These authors provide a history and description of various types of pipeline coatings; offer practical information on how to select, test, evaluate, and compare different coating systems; and discuss how coatings work with Cathodic Protection (CP)/CP shielding.

This book provides the reader with a history of generic pipeline coating types, technical information about testing, application and use. There is very practical information about selection and evaluation methods for each type of coating system to help those who design pipeline systems. There is also discussion of how coatings work with cathodic protection, cathodic protection shielding by coatings and other related issues with the various coating systems related to CP.

2017 by NACE, 7″ x 9″, soft cover, 264 pages.

New Tantalum Alloy Resists Highly Corrosive Environments

By Paul Aimone on 8/31/2017 1:39 PM

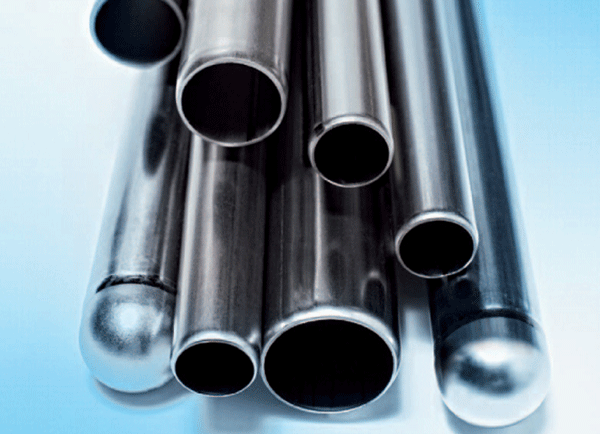
Tantalum Tubing for Chemical Processing. Photo courtesy of H.C. Starck.

Tantalum and tantalum alloys have been used in electronic, chemical processing, and other industries for many years. The largest single use of tantalum is as a powder in capacitors. The tantalum oxide film that forms on tantalum serves as a dielectric. Mill products also comprise a very significant market for tantalum and tantalum alloys. Tantalum mill products such as plate, sheet, foil, tube, rod, and wire are extensively used in the chemical, pharmaceutical, electronic, semiconductor, medical, aerospace, and tooling industries. Tantalum mill products are, for the most part, produced by a combination of ingot metallurgy and thermomechanical processing regardless of the product’s final form.

Pure tantalum and tantalum alloys have excellent corrosion resistance1 and are used in chemical processing and pharmaceutical equipment where hot, highly corrosive environments are encountered. Heat exchangers, liners, feed lances, rupture disks, and various other components are fabricated from these materials. Tantalum and tantalum alloys are resistant to most acids (one exception is hydrofluoric acid [HF]) in a wide range of concentrations and temperatures and exhibit corrosion resistance that is similar to glass; and are often the material of choice when other alloys would rapidly corrode and fail in service.

Tantalum’s excellent corrosion resistance results from the formation of an extremely stable tantalum pentoxide (Ta2O5) layer.2 In temperatures ranging from 190 to 250 °C, however, the Ta2O5 layer can degrade, depending on the process environment, and allow rapid chemical attack of the component. In the presence of hot, hydrogen-containing acids, diffusion of atomic hydrogen along grain boundaries can lead to hydrogen embrittlement (HE).2 Rather than metal loss from corrosion, HE is the predominant failure mechanism for tantalum components in the chemical processing industry. Carbon, hydrogen, nitrogen, and oxygen begin to significantly embrittle tantalum at individual concentrations of 100, 100, 1,000, and 1,000 ppm, respectively.

Operational Limits of Tantalum Material in CPI

Tantalum and tantalum alloys are used almost exclusively in processes that require extremely hot, concentrated hydrochloric acid (HCl) or sulfuric acid (H2SO4). Temperature limits for tantalum in HCl and H2SO4 to minimize corrosion rates (5 mpy [127 µm/y]) are shown in Table 1.

As these temperature limits are approached and exceeded, corrosion and rapid HE can occur. Presently cathodic protection using small platinum spots affixed to the surface of a tantalum component is the most prevalent method used for slowing HE in tantalum alloys. Over time, however, these spots dissolve and need to be replaced.

Previous studies demonstrated that platinum spotting improved the corrosion and HE resistance of pure tantalum, although the effect was almost insignificant for the tantalum-tungsten alloy Ta-3W.3 Consequently, H.C. Starck (Newton, Massachusetts) successfully developed a derivative of the Ta-3W alloy that incorporates platinum-group elements such as platinum or ruthenium, which significantly improved the alloy’s corrosion and HE resistance.1 This new alloy maintains the same physical, mechanical, and fabrication properties as the original Ta-3W alloy.

Figures 1 through 4 show the results from corrosion evaluations of the new platinum-containing Ta-3W alloy in 30% HCl and 96% H2SO4.4 Test specimens, measuring ~1 by 1.5 by 0.02 in (25 by 38 by 0.5 mm), were cleaned, weighed, and measured prior to testing. Individual test specimens were fully immersed in an acid solution. Conventional Ta-3W samples were tested as a baseline along with the new alloys. The samples were separated from each other using polytetrafluoroethylene (PTFE) spacers. All tests, except for the samples immersed in HCl, were performed in conventional plastic labware. The HCl tests were performed in specialized, PTFE-lined pressure vessels. After the tests were completed, each sample was rinsed and dried. Corrosion rate evaluations were performed based on weight change. Localized corrosion attack was evaluated by visual examination at 20x. The corrosion rate (mpy) was calculated based on the weight-change data. Hydrogen enrichment was determined by wet chemistry techniques where the sample was dissolved in acid and then analyzed.

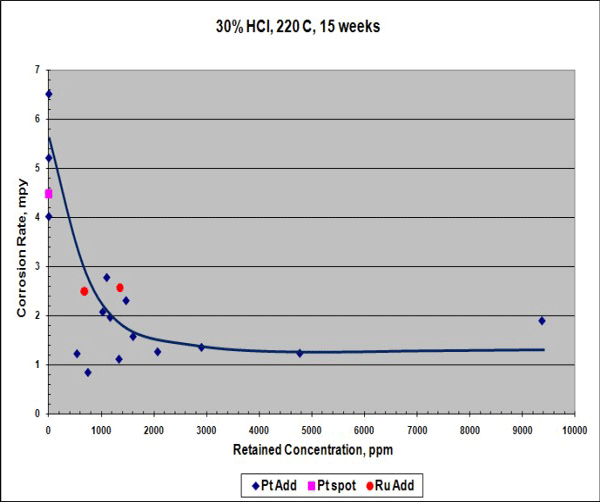
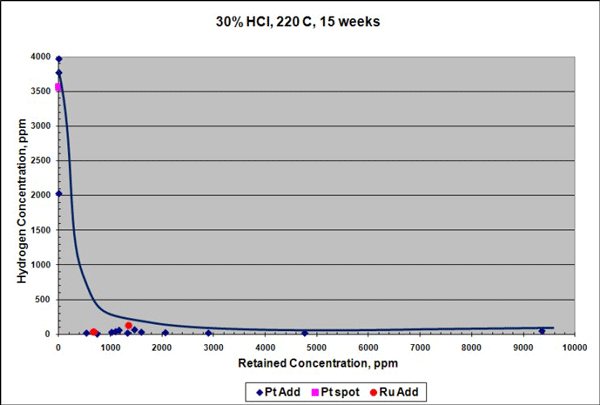
When exposed to 30% HCl acid at 220 °C for 15 weeks, the corrosion rate of the Ta-3W alloy with platinum was reduced (Figure 1), although this rate is already low. Hydrogen enrichment (embrittlement) dropped by more than 100 times compared to the conventional Ta-3W alloy with or without platinum spots (Figure 2). In Figures 1 and 2, the data points at 0 ppm retained concentration represent the test results for conventional Ta-3W.

FIGURE 1: Corrosion rate for Pt-modified Ta-3W in 30% HCl.

FIGURE 1: Corrosion rate for Pt-modified Ta-3W in 30% HCl.
FIGURE 2: Hydrogen enrichment for Pt-modified Ta-3W in 30% HCl.

FIGURE 2: Hydrogen enrichment for Pt-modified Ta-3W in 30% HCl.

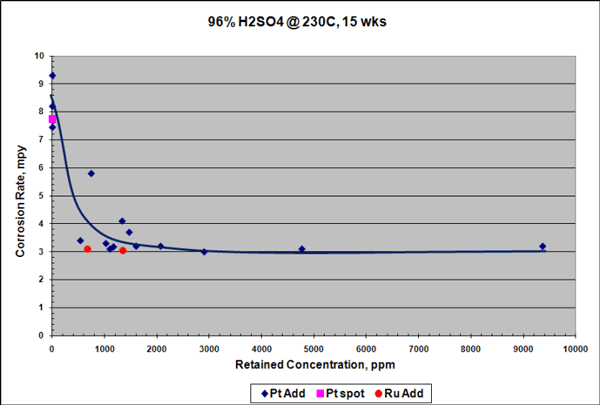
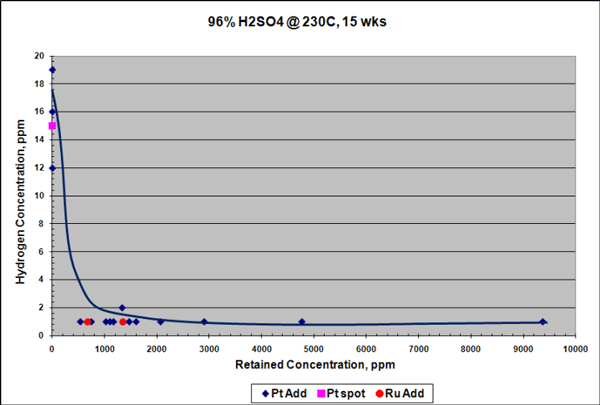
Similar results were seen for samples exposed to 96% H2SO4 at 230 °C for 15 weeks, although the reduction in corrosion rate in H2SO4 was not as pronounced as in HCl. Platinum additions reduced the corrosion rate of the Ta-3W alloy up to 3 times (Figure 3), and there was no measurable hydrogen enrichment at this temperature, as shown in Figure 4. Raising the temperature to 250 °C increased the corrosion rate of the platinum-containing alloy to ~7 mpy (178 µm/y), but with no measurable hydrogen enrichment. It is theorized that platinum improves corrosion and HE resistance in tantalum by producing low hydrogen overvoltage sites within the alloy that shift its electrical potential in a more noble, positive direction. This would help stabilize and preserve the protective Ta2O5surface oxide film.

FIGURE 3: Corrosion rate for Pt-modified Ta-3W in 96% H<sub>2</sub>SO<sub>4</sub>.

FIGURE 3: Corrosion rate for Pt-modified Ta-3W in 96% H2SO4.
FIGURE 4: Hydrogen enrichment for Pt-modified Ta-3W in 96% H<sub>2</sub>SO<sub>4</sub>.

FIGURE 4: Hydrogen enrichment for Pt-modified Ta-3W in 96% H2SO4.

While platinum additions clearly improve the corrosion performance of the Ta-3W alloy, at the concentration ranges used in the modified alloy described here, there is a significant cost impact associated with this alloying element. Ruthenium has been shown to improve the corrosion performance of titanium alloys by reducing the hydrogen overvoltage in various acid media.5 The results of recently completed trials show that adding low levels of ruthenium also improve the corrosion and hydrogen enrichment resistance of the Ta-3W alloy in both HCl and H2SO4 at high temperatures. More importantly, this improvement in corrosion resistance is achieved in the same concentration ranges (i.e., optimally 1,000 to 3,000 ppm) as the platinum-containing Ta-3W alloy. Since ruthenium is roughly 10% of the cost of platinum at the time this paper was written, a Ta-3W alloy with ruthenium would potentially offer the superior corrosion performance of the Ta-3W alloy with platinum at a significant cost savings.

References

1. P. Aimone, E. Hinshaw, “Tantalum Materials in the CPI for the Next Millennium,” CORROSION 2001, paper no. 01330 (Houston, TX: NACE International, 2001).

2. J. Chelius, “Use of Refractory Metals in Corrosive Environment Service,” Mater. Eng. Quart. Aug (1957): pp. 57-59.

3. E. Rabald, Materials and Corrosion, Vol. 12 (Weinheim Germany: WILEY-VCH Verlag GmbH & Co., 1961), pp. 695-698.

4. P. Aimone, “A New Tantalum Alloy with Improved Corrosion and Hydrogen Embrittlement Resistance,” Proc. 7th Corrosion Solutions Conference, held September 21-23, 2009 (Huntsville, AL: ATI Wah Chang, 2009).

5. R.W. Schutz, “Ruthenium Enhanced Titanium Alloys,” Platinum Metals Rev. 40, 2 (1996): pp. 54-61.

Graphene Nanoplatelets Boost Barrier Protection to Epoxy Coatings

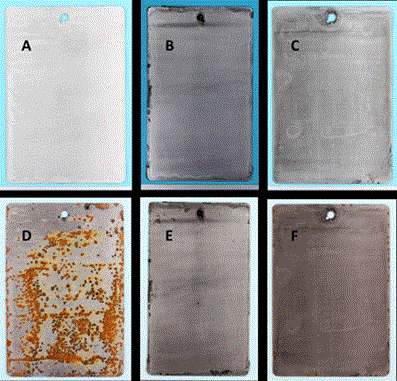
FIGURE 1: Epoxy-coated steel panels before (A, B, C) and after (D, E, F) 1,000 h of salt fog testing: (A) 0% graphene control at 0 h; (B) 0.5% Sample 2 at 0 h (C) 5.0% Sample 1 at 0 h; (D) 0% graphene control at 1,000 h; € 0.5% Sample 2 at 1,000 h; and (F) 5.0% Sample 1 at 1,000 h. Photos courtesy of AGM.
Graphene, due to its exceptional electrical and mechanical properties, has attracted attention as a potential material for imparting anticorrosive performance. Graphene is a carbon allotrope with a two-dimensional molecular structure comprised of a single layer of carbon atoms bonded together in a hexagonal lattice structure. Bohm1 proposed that graphene’s two dimensional platelet structure enables excellent performance in barrier coatings based on its high surface area, electrical conductivity, and impermeable nature.

This enhanced performance may be explained by the combination of three characteristics: graphene makes the path of water permeation more difficult; the impermeability of graphene’s molecular structure reduces the penetration of oxygen, water, and other corrosive materials; and graphene provides an alternative path for electrons and breaks the electrochemical cell that is necessary for corrosion. Subsequently, graphene has been investigated to explore its corrosion-resistant capabilities.

Work has included doping graphene with corrosion inhibitors1 and depositing it on substrates using chemical vapor deposition (CVD). Potentiometric analysis and traditional corrosion testing has suggested that graphene can provide significant performance improvement.2, 3 A large part of this work has been done with discrete layers of graphene grown via CVD or applied directly to surfaces.

Applied Graphene Materials (AGM) (Cleveland, United Kingdom) has developed and patented a unique graphene synthesis process to produce dispersion-ready graphene nanoplatelets using sustainable raw material sources rather than exfoliating graphene from graphite. Development work is underway that explores the ability of graphene nanoplatelets distributed throughout a coating film to function in a comparable manner to a monolayer of graphene applied by CVD, and evaluates their ability to prevent corrosion. Such an approach could open up the opportunity for coating manufacturers to utilize graphene when formulating coatings with improved performance.

Independent industry experts Paint Research Association (PRA) (Leicestershire, United Kingdom) and The Welding Institute (TWI) (Cambridge, United Kingdom) worked with AGM to complete an evaluation of graphene nanoplatelets in an epoxy coating, with the aim of demonstrating how a graphene-enhanced coating may be useful in preventing corrosion.

Two grades of graphene platelets were evaluated—a medium density graphene with a rigid platelet structure and built-in oxygen functionality that provides good dispersibility (Sample 1), and an ultra-low-density, high-surface-area graphene that has a flexible, crumpled sheet morphology (Sample 2). These materials were selected because they each have properties that can be useful in preventing corrosion. A two-pack epoxy system, cured with a proprietary unmodified aliphatic amine hardener system, was selected to represent epoxy primer systems used to protect steel and aluminum structures.

The graphene was dispersed directly into the resin at loading levels that ranged from 0.1 wt% to 5.0 wt%. Sample 2 was limited to a maximum loading level of 1.0 wt% due to its very-high surface area. The graphene coatings were applied to mild steel panels that were hand-abraded according to ISO 15144 and cleaned with xylene. The panels were then cured for seven days at 18 to 25 °C to create a dry film thickness of 40 µm for testing using a draw-down method.

Cyclic corrosion resistance was tested according to BS EN ISO 11997-25 modified to remove ultraviolet light exposure. Using a repeating cycle for a total of 1,000 h, duplicate specimens were exposed for 60 min to dilute electrolyte fog (0.35% ammonium sulfate [(NH4)2SO4] and 0.05% sodium chloride [NaCl]) at ~24 °C followed by 60 min drying time with temperatures rising to 35 °C. Panels were checked regularly to monitor the progression of corrosion and were rated at three and six weeks for defects such as blistering and rusting following the guidelines of ISO 4628-2.6

Figure 1 shows representative images of a selection of panels before and after 1,000 h of salt fog testing. The graphene-loaded epoxy-coated samples remained corrosion free for up to 12 days, and then only showed very small, localized spotting. This localized corrosion appeared to be limited to regions where there had been defects or pitting in the coating. There was also an increase in the time it took for the onset of corrosion—the appearance of black rust spots—with increased graphene loading. The best performance was achieved with 5.0% of Sample 1 and 0.5% of Sample 2.

Following the positive results in the cyclic salt fog testing, the graphene-enhanced epoxy coatings were subjected to immersion testing. Steel panels, hand-abraded and cleaned with xylene, were fully immersed in synthetic seawater (prepared according to ASTM D11417) at ambient temperature (20 to 30 °C) for 30 days. Upon completion of the immersion testing, samples were cross-sectioned and imaged by scanning electron microscopy (SEM).

FIGURE 2: Epoxy-coated steel panels before (A, B, C) and after (D, E, F) 30 days of immersion testing in synthetic sea water: (A) 0% graphene control at 0 days; (B) 1.0% Sample Grade B at 0 days; (C) 1.0% Sample Grade A at 0 days;(D) 0% graphene control at 30 days; (E) 1.0% Sample Grade B at 30 days; and (F) 1.0% Sample Grade A at 30 days. Photos courtesy of AGM.

FIGURE 2: Epoxy-coated steel panels before (A, B, C) and after (D, E, F) 30 days of immersion testing in synthetic sea water: (A) 0% graphene control at 0 days; (B) 1.0% Sample Grade B at 0 days; (C) 1.0% Sample Grade A at 0 days;(D) 0% graphene control at 30 days; (E) 1.0% Sample Grade B at 30 days; and (F) 1.0% Sample Grade A at 30 days. Photos courtesy of AGM.

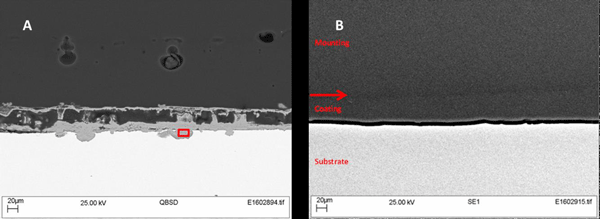
Figure 2 shows photographs of the epoxy-coated steel panels before and after the 30-day immersion in synthetic seawater. The panel with the graphene-free control epoxy suffered severe corrosion and rusting, while the panels with the graphene-loaded epoxy were virtually corrosion free. The graphene significantly enhanced the corrosion mitigation of the epoxy coating even at loading levels as low as 0.1 wt%. Typically, corrosion mitigation improved as the loading level of graphene increased. SEM images for Sample 2 (Figure 3) show the coating remained intact, with no rusting or corrosion visible at the surface of the substrate. The diffusion of water and salts to the surface was prevented by the graphene in the coating.

Because corrosion is an electrochemical process—an electrical current is produced as the metal in the substrate is oxidized—electrochemical monitoring of a substrate during immersion testing provides useful information about how well the coating is protecting the steel panel. Monitoring this electrical current can quantify the amount and rate of corrosion. In experiments with electrochemical testing, panels coated with graphene-loaded epoxy were immersed in synthetic seawater and measurements taken using a three-electrode system. The corrosion current for each sample was monitored over the 30 days of immersion.

FIGURE 3: SEM micrographs of cross-sectioned steel panels coated with graphene-loaded epoxy after immersion testing: (A) 0% graphene control shows growth of corrosion products under the epoxy coating—the inset red box marks area examined using energy dispersive x-ray analysis; and (B) 0.5% Sample Grade B showing no corrosion of the steel substrate under the coating. Images courtesy of AGM.

FIGURE 3: SEM micrographs of cross-sectioned steel panels coated with graphene-loaded epoxy after immersion testing: (A) 0% graphene control shows growth of corrosion products under the epoxy coating—the inset red box marks area examined using energy dispersive x-ray analysis; and (B) 0.5% Sample Grade B showing no corrosion of the steel substrate under the coating. Images courtesy of AGM.

The corrosion current recorded for the samples coated with graphene-loaded epoxy was roughly 1,000 times smaller than for the control sample coated with graphene-free epoxy. This very low corrosion current correlates with the conclusions from the visual assessment and the SEM analysis, and confirms that the addition of graphene to the epoxy improves the corrosion protection provided by the epoxy coating.

The proposed explanation for this is that the graphene nanoplatelets act as a barrier to the diffusion of water and corrosive salts through the epoxy coating. The water vapor transmission rate (WVTR) through the epoxy coatings was measured following ASTM D1653-038 using Test Method B (wet cup method), Condition A (23 °C, 50% relative humidity). Samples of graphene-free epoxy and epoxy loaded with Sample Grade A and Sample Grade B were coated onto a paper substrate for this test.

The results of the WVTR test showed a clear reduction in the diffusion rate of moisture through the graphene-loaded epoxy samples. The data show that the graphene-free control epoxy had a WVTR of ~200 g/m2/day. The addition of the smallest amounts of graphene tested, 0.1 wt%, reduced this diffusion rate by a factor of almost 100. A WVTR of less than 10 g/m2/day was recorded for all graphene-loaded epoxy samples.

The data support the proposed mechanism that the graphene nanoplatelets form a very effective diffusion barrier by effectively forming a tortuous path to the substrate and greatly increasing the time it would take for corrosive elements to migrate through the coating. The effective barrier properties of the graphene nanoplatelets in the epoxy coatings may explain the corrosion mitigation observed on the steel panels in both immersion testing and cyclic salt fog testing.

Source: Lynn Chikosha, Adrian Potts, and William Weaver, Applied Graphene Materials,appliedgraphenematerials.com. Contact Marie Robinson—email:marie.robinson@appliedgraphenematerials.com.

References

1 S. Bohm, “Graphene against Corrosion,” Nat. Nanotechnology 9, 10 (2014): pp. 741-742.

2 R.S Raman, et al., “Protecting copper from electrochemical degradation by graphene coatings,” Carbon 50, 11 (2012): pp. 4040-4045.

3 R.V. Dennis et al., “Graphene nano-composite coatings for protecting low alloy steels from corrosion,” Am. Ceram. Soc. Bull. 92, (2013): pp. 18-24.

4 ISO 1514:2016, “Paints and varnishes—Standard panels for testing” (Geneva, Switzerland: ISO, 2016).

5 BS EN ISO 11997-2:2013, “Paints and varnishes. Determination of resistance to cyclic corrosion conditions. Wet (salt fog)/dry/humidity/UV light” (London, U.K.: BSI, 2013).

6 ISO 4628-2:2016, “Paints and varnishes —Evaluation of degradation of coatings — Designation of quantity and size of defects, and of intensity of uniform changes in appearance —Part 2: Assessment of degree of blistering” (Geneva, Switzerland: ISO, 2016).

7 ASTM D1141-98(2013), “Standard Practice for the Preparation of Substitute Ocean Water” (West Conshohocken, PA: ASTM, 2013).

8 ASTM D1653-03, “Standard Test Methods for Water Vapor Transmission of Organic Coating Films” (West Conshohocken, PA: ASTM, 2003).

Detecting Corrosive Sulfides Challenges U.S. Shale Operators

By Ben DuBose on 7/31/2017 2:19 PM

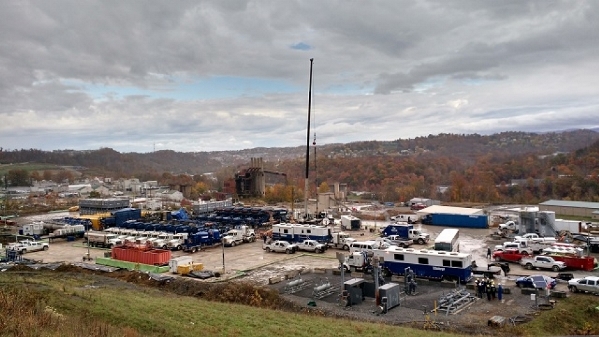
Researchers studied oil and gas wells in the Utica Shale region of the United States for the presence of corrosive sulfides. Photo courtesy of Rebecca Daly, The Ohio State University.

Many modern tests focused on the detection of sulfate-reducing bacteria (SRB) as corrosive agents in U.S. shale infrastructure could be missing a separate bacterial family also responsible for toxic, corrosive sulfides, according to a case study1 conducted by researchers at several major institutions.

In the study published this year, researchers at The Ohio State University (Columbus, Ohio), West Virginia University (Morgantown, West Virginia), and the U.S. Pacific Northwest National Lab (Richland, Washington) decided to track sulfur cycling catalyzed by the microbial community in a hydraulically fractured well in the Utica Shale formation near Flushing, Ohio.

“The well continually pulls up fluids that have been sitting in the fractures for months, so it’s a good way to get a chemical and biological look at what’s going on down there,” says Mike Wilkins, an environmental microbiologist at Ohio State and senior researcher on the study.

Based on their findings, the researchers believe the oil and gas industry may need to adopt new methods of monitoring and mitigating sulfide-producing bacteria in fractured shales.

How Fracking Influences Microbial Environment

The “fracking” process involves high-pressure injections of water, sand, and chemicals to create fracture networks that release oil and gas, which are pumped back to the surface and recovered. According to Wilkins, since this process has only taken off in the past decade, not much is known about the microbial ecosystems in these networks.

“This is a pretty inhospitable environment of high pressure, salinity, and temperature some 2,000 meters underground,” Wilkins explains. “The industry spends a fair amount of money trying to keep microbes out of these systems.”

These sulfide-producing microbes can cause a number of problems for drilling operators, including the corrosive degradation of metal pipelines and toxic exposure to workers on the drilling pad. Hydrogen sulfide (H2S) can also “sour” a well, Wilkins says, noting that H2S must be separated from oil and gas in an expensive process. Furthermore, the microbes themselves can gum up the extraction process by filling in tiny fractures with either biomass or excreted precipitates, he adds.

In metallic pipelines, this microbiologically influenced corrosion (MIC) is most frequently seen in the form of localized pitting.

Case Study Results

Wilkins’ team had previously found that one bacterial family in particular, Halanaerobium, was particularly present in fractured well ecosystems. These bacteria can convert thiosulfates found in the well environment to sulfide, in contrast to SRB—which convert sulfate to sulfide.

Within 10 days after the pumping and sampling of well fluids had begun, the researchers found the Halanaerobium family had reached nearly 100% dominance within the bacterial community and remained so for the next 100 days.

The researchers then examined the genes present to find enzymes that might be capable of catalyzing sulfur reactions. In doing so, they found multiple copies of rhodanese—an enzyme that can reduce thiosulfate to sulfite and elemental sulfur. They also discovered multiple copies of anaerobic sulfite reductase, an enzyme that reduces sulfite to sulfide. With these two enzymes together in the well environment, it would be possible to convert thiosulfate to sulfide, Wilkins explains.

To confirm this, the researchers cultured Halanaerobium isolated from well samples. In their test, the lab-grown bacteria produced both enzymes. And when fed thiosulfate in the culture, sulfide was produced. The team also measured a particular sulfur isotope that microbes prefer to consume and found that it decreased in the well samples over time.

“That’s a sign that the sulfur cycling seen in this well is a microbial process, rather than an abiotic one,” Wilkins says.

Problems with Existing Industry Tests

But according to Wilkins, most current industry tests monitor for these microbes by only searching for SRB activity. “Sulfate-reducing bacteria [SRB] are super common in seawater and groundwater and convert sulfate to sulfide,” he explains. As a result, efforts are frequently made to ensure that low-sulfate fluids are used for fracking injections.

In the Utica case study, however, no evidence of SRB was found in the data sets. Based on that, Wilkins says many existing industry tests could mistakenly lead a well operator to think that no sulfide was produced. In reality, of course, the researchers found the Halanaerobium bacteria—not SRB—had led to the formation of sulfides.

“Knowing which microbes are doing potential damage is important so that well operators can target them better,” Wilkins says, adding that the Halanaerobium family has been found in fractured well ecosystems from Texas to Pennsylvania.

Funding for the study was provided by the National Science Foundation (Arlington, Virginia) and the U.S. Department of Energy (Washington, DC).

Source: American Society for Microbiology, www.asm.org. Contact Mike Wilkins, The Ohio State University—Email: wilkins.231@osu.edu.

Reference

1 A.E. Booker, et al., “Sulfide Generation by Dominant Halanaerobium Microorganisms in Hydraulically Fractured Shales,” mSphere 2, 4 (2017).

Specification and Inspection Play Vital Role in Coating Steel Structures

By R. Prasanna on 7/31/2017 2:22 PM

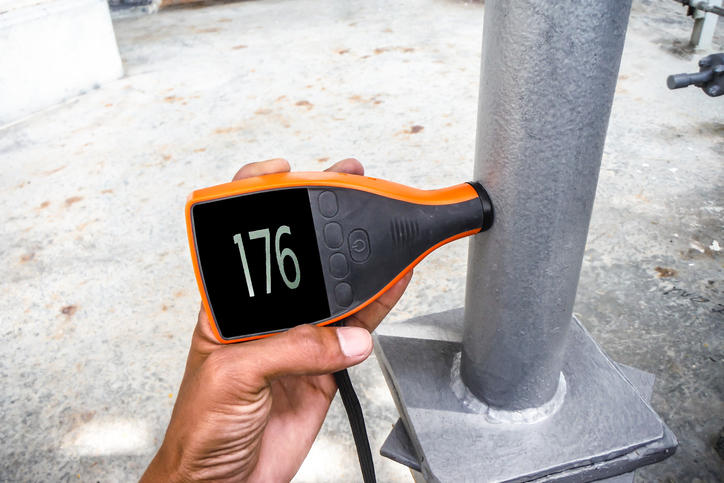
The use of a coating thickness gauge can be a key part of the inspection process on steel structures.

The coating specification will determine the entire scope of any coating project. Specifically, for a painting project, this is broken down into three broad categories: the product to be used, the surface preparation required, and application of the product.

The Product

Sole spec” sheets are written specifically for a certain product. This is a situation where “shall” or an equally stern term will be used to refer to the product to be used. In some instances, a few options may be provided, as indicated by the word “may,” where a substitute or alternative is acceptable provided all requirements are satisfied.

Surface Preparation

The most commonly accepted industry standards pertaining to surface preparation have been devised by several national and international bodies (e.g., NACE International and SSPC: The Society for Protective Coatings). These standards are used when assessing the readiness of a surface to receive a coat of paint. These surface preparation standards range from solvent cleaning (SSPC-SP 11) to industrial blast cleaning (NACE No. 8/SSPC-SP 142).The proper anchor pattern is essential for optimal coating adhesion. Each standard defines the method of cleaning as well as criteria for evaluating the outcome. Because surface preparation is such a tremendously important step in the process (an improperly prepared surface is a surefire way to shorten the coating’s service life), specification sheets must either stipulate the required level of surface preparation or direct the contractor to a product data sheet that does so.

Please note that a product data sheet by itself is not a technical specification.

Application

Coating application is another section of the specification that should heavily reference specific product data sheets. The ambient conditions, number of coats, and mil thickness required for a successful application should be spelled out in that document. The specification should also identify the method to be used for coating application. If a specific formulation (e.g., a 100% solids formulation) is called for, this section should also include any notes on required application equipment, such as plural component pumps. The contractor should also be made aware of any other challenges that may arise during the application process in this section of the specification sheet.

The paint specification must stipulate which products are required (or product characteristics that must be satisfied) and how they need to be applied, as well as the surface preparation required for the job. These are the core elements of a paint specification.

Understanding the Basic Concepts of a Painting System

The various superimposed coats within a painting system must, of course, be compatible with one another. They all may be the same generic type or different types (e.g., chemical resistant types, such as a recoatable polyurethane finish coat, may be applied onto epoxy primers and intermediate coats). As a precaution, however, all paints within a system should normally be obtained from the same manufacturer and used in accordance with the manufacturer’s recommendations.

An important factor in the coating system is the definition and measurement of the dry film thickness (DFT). Generally, DFTs are checked on the completed paint system, although individual films may be checked separately. Usually, nominal DFTs are specified, but sometimes minimum values are quoted.

For nominal DFTs, individual values <80% of the nominal thickness are not acceptable. Values between 80 and 100% are acceptable provided that the overall average (mean value) is equal to or greater than the nominal value.

On-Site Quality Control Inspection

Inspection forms an integral part of quality control. Its purpose is to ensure that the project complies with the requirements of the specification and to provide the client a report with proper records.

One of the greatest assets for the coating inspector is a clearly written specification that can be referred to without doubt. The appointment of an appropriately qualified inspector should be seen as an investment in quality and not just an additional cost. Inspection of the processes, procedures, and materials required for the protective coating of steel structures is vital, since a major error in even one operation cannot easily be detected after the next operation has been completed; and, if not rectified immediately, can significantly reduce the expected service life of the coating.

Practical Scenario—A Case History

During an engineer procure construct project, the specification allowed two types of painting application (spray as well as brush). The stake holder thoroughly analyzed the environment, application method, and special requirements before starting the process.

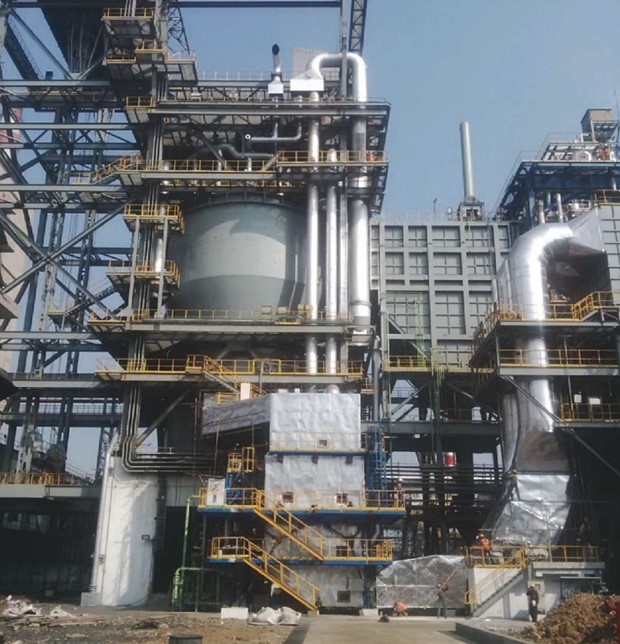
FIGURE 1 The structures pictured consist of the charging crane, cooling chamber, boiler, and primary dust catcher of the coke dry quench (CDQ) system. Photo courtesy of Tata Steel—Kalinganagar—Orissa—India.

FIGURE 1 The structures pictured consist of the charging crane, cooling chamber, boiler, and primary dust catcher of the coke dry quench (CDQ) system. Photo courtesy of Tata Steel—Kalinganagar—Orissa—India.

A detailed specification for the roller method was developed in order to ensure quality and durability, which resulted in a 20% saving of paint toward the loss factor. The entire structure was coated by roller application (Figure 1).

Conclusion

The overall success of a protective coating scheme can be influenced by many factors. A well-prepared specification document is an essential component that is intended to provide clear and precise instructions to the coating contractor and inspector on what is to be done and how it is to be done. It should be drafted by someone with appropriate technical expertise, and it should be clear as to what is required in terms of what is practical and achievable.

References

1 SSPC-SP 1, “Solvent Cleaning” (Pittsburgh, PA: SSPC).

2 NACE No. 8/SSPC-SP 14, “Industrial Blast Cleaning” (Houston, TX: NACE International).