King Abdulaziz Foundation Uses Advanced Technology to Map Prophet Muhammad’s Steps

King Abdulaziz Foundation Uses Advanced Technology to Map Prophet Muhammad’s Steps

By Shahabuddin Amerudin

Introduction

The integration of modern technology with historical research is transforming the way we understand and preserve the past. One such remarkable endeavor is the project initiated by the King Abdulaziz Foundation for Research and Archives (Darah), aimed at creating a comprehensive atlas documenting the life of the Prophet Muhammad. This initiative, which reflects Saudi Arabia’s dedication to preserving Islamic and Arab history, leverages advanced geospatial technologies to map and visualize the key locations and events from the Prophet’s life.

This paper explores the methodology, technological integration, and broader implications of this project, examining how it bridges traditional historical scholarship with cutting-edge technological advancements.

Historical Foundation and Significance

The Prophet Muhammad’s life holds immense significance in Islamic history, and documenting his journey is crucial for Muslims around the world. The King Abdulaziz Foundation, known as Darah, has a long-standing commitment to preserving Islamic heritage, and this project builds on its expertise in developing historical atlases. According to Sultan Alawairidhi, the official spokesperson of Darah, “The project stems from Darah’s commitment to preserving Islamic and Arab history, building on its expertise in developing historical atlases” (Alshammari, 2024).

This initiative was launched under the leadership of King Salman, who chaired Darah’s board when the project was initiated several years ago, and it continues to receive the support of Crown Prince Mohammed bin Salman and supervision from Prince Faisal bin Salman, chairman of Darah’s board of directors. The project aligns with Saudi Arabia’s broader goals of preserving its historical and religious heritage and sharing it with a global audience.

Methodology: The Fusion of Historical Research and Modern Technology

The atlas project relies on an extensive team of historians, researchers, and scholars from universities and research centers. These experts meticulously source data from original texts such as the Hadith, biographies (Sirah), and other Islamic historical literature. According to Alawairidhi, the foundation is “using reliable sources and advanced technologies to ensure the project’s accuracy” (Alshammari, 2024). This meticulous approach ensures the accuracy of the geographical and historical data being compiled.

A key aspect of this project is the integration of geographic information systems (GIS) to map and visualize the significant locations associated with the Prophet’s life. This involves determining geographic coordinates for important sites such as the Prophet’s birthplace in Makkah, his migration route to Madinah (Hijra), and the locations of key battles. These coordinates are cross-referenced with historical texts to ensure precision.

Technological Integration: GIS, Satellite Imagery, and Interactive Maps

The use of cutting-edge technologies is central to this project. The team at Darah employs geographic coordinates, satellite imagery, and GIS tools to document and map significant landmarks. “By harnessing these technologies in the service of the noble Prophetic biography, we aim to achieve the atlas’s objectives and collaborate with relevant institutions and specialized researchers in universities and scientific research centers,” Alawairidhi explained (Alshammari, 2024).

The atlas is designed to visually represent key moments in the Prophet’s life, transforming historical narratives into accessible visual formats. Satellite imagery, for example, helps to provide modern views of the ancient landscapes where historical events took place. GIS enables the overlay of these historical events onto current geographical maps, allowing for an interactive exploration of the Prophet’s journey.

An interactive online platform is planned for the project, which will allow users to explore these maps and timelines in detail. This platform will include zoomable maps, timelines of events, and additional resources such as diagrams, illustrations, and educational materials. The project is also set to include a mobile application, which will offer a similar user experience, with added geolocation features for visitors traveling to historical Islamic sites.

Visualization and Educational Tools

The atlas will not only serve as a scholarly reference but will also include a range of educational tools to engage different audiences. These tools include maps, illustrations, diagrams, and images that transform the Prophet’s life into visual pathways. By integrating both static and interactive elements, the atlas will serve as both an educational and devotional resource.

Moreover, specialized materials will be developed for children, using simplified maps and illustrations to make the Prophet’s biography accessible to younger audiences. This ensures that the project caters to a wide demographic, from scholars to laypeople and from adults to children.

Public Engagement and Outreach

In addition to the atlas, the project will involve the creation of supplementary materials and public engagement initiatives. An exhibition on the Prophet’s biography is planned, which will showcase key locations, maps, and visual materials from the atlas. This exhibition will serve as an interactive experience for visitors, allowing them to engage with the historical material in a meaningful way. There are also plans for specialized publications, conferences, and workshops that will further disseminate the findings of the project.

One of the project’s most significant elements is the planned international conference on the historical sites featured in the Prophet’s biography. This conference will bring together scholars from around the world to discuss the historical and religious significance of these sites and how they can be preserved and shared with future generations.

Conclusion

The King Abdulaziz Foundation’s atlas documenting the life of Prophet Muhammad is an ambitious and pioneering project that exemplifies the fusion of historical research with modern technology. By using GIS, satellite imagery, and interactive maps, the project offers a visual and educational representation of the Prophet’s life, making it accessible to a global audience.

As the project progresses, it promises to not only preserve Islamic history but also to serve as a scholarly resource and an educational tool for Muslims worldwide. The use of technology in this context demonstrates how modern advancements can be harnessed to preserve and share religious and cultural heritage in innovative ways. As Alawairidhi aptly stated, “We aim to achieve the atlas’s objectives and collaborate with relevant institutions and specialized researchers in universities and scientific research centers” (Alshammari, 2024), showcasing the project’s collaborative and forward-thinking nature.

References

Alshammari, H. (2024, June 5). King Abdulaziz Foundation uses advanced tech to map Prophet Muhammad’s steps. Arab News. Retrieved from https://www.arabnews.com/node/2524581/saudi-arabia

From AHP to GWR in Sinkhole Susceptibility Modeling with Advanced GIS Methods

sinkhole

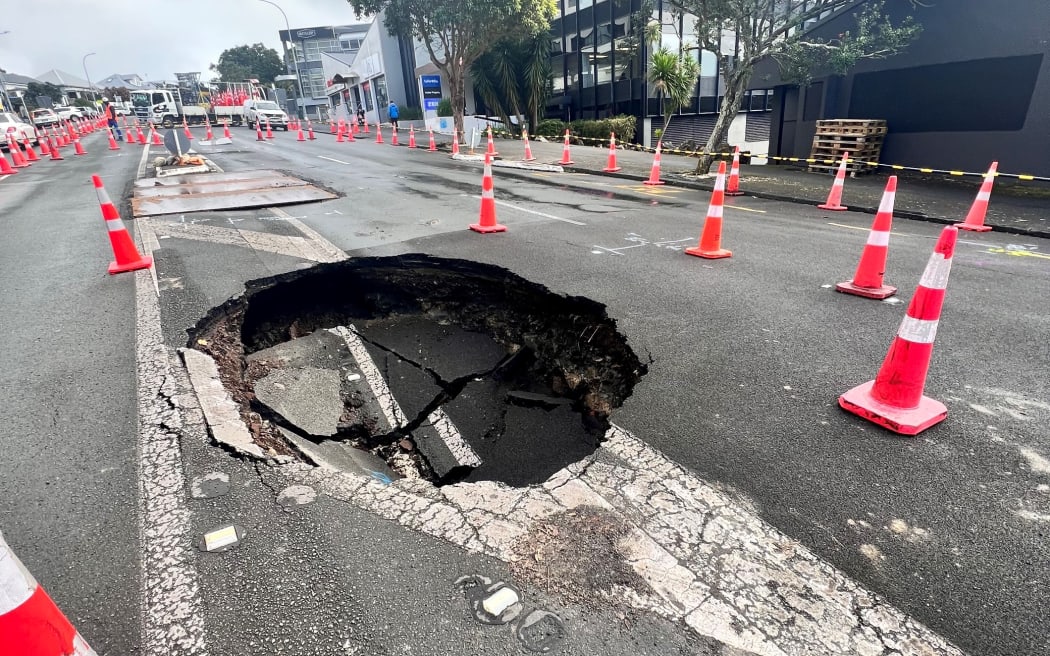
Introduction

Rosdi et al. (2017) made significant strides in understanding sinkhole susceptibility in Kuala Lumpur and Ampang Jaya by combining Geographic Information Systems (GIS) with the Analytical Hierarchical Process (AHP). Their work laid a solid foundation for assessing sinkhole risk, but there remains an opportunity to refine and enhance these models using more advanced spatial analysis techniques. One promising approach is Geographically Weighted Regression (GWR), which has the potential to improve both the accuracy and granularity of sinkhole susceptibility assessments. This article examines how incorporating GWR, along with other advanced GIS methodologies, could lead to more precise and insightful analyses of sinkhole hazards.

1. Application of Geographically Weighted Regression (GWR)

Geographically Weighted Regression (GWR) represents an evolution from traditional regression models by allowing for spatial variability in the relationships between variables. Unlike global models that assume a uniform relationship across the study area, GWR acknowledges that these relationships can vary from one location to another. This spatial flexibility is crucial for understanding sinkhole formation, as it reveals how different factors influence sinkhole risk in distinct geographical contexts (Fotheringham et al., 2002).

Applying GWR to the analysis of sinkhole susceptibility in Kuala Lumpur and Ampang Jaya could illuminate how key factors such as lithology, groundwater level decline, soil type, land use, and proximity to groundwater wells affect sinkhole risk differently across various regions. For instance, the impact of lithology might be more pronounced in areas with specific geological features, while groundwater decline could play a more significant role in other areas. By capturing these spatial differences, GWR would provide a more nuanced and accurate understanding of sinkhole susceptibility (Brunsdon et al., 1996).

GWR offers several advantages for sinkhole susceptibility analysis. It allows for localized insights by identifying areas where certain factors disproportionately affect sinkhole formation, thereby enabling more targeted and effective mitigation strategies. Additionally, by accounting for spatial heterogeneity, GWR can enhance the accuracy of susceptibility models, leading to improved predictions and risk assessments. The results from GWR can also be visualized as spatially varying coefficients, providing a clear and interpretable representation of how each factor’s influence varies across the study area (Fotheringham et al., 2002).

2. Integration of High-Resolution Remote Sensing Data

The current study’s reliance on existing land use data can be significantly improved by incorporating high-resolution remote sensing imagery from satellites or unmanned aerial vehicles (UAVs). This approach would allow for the development of more accurate and up-to-date land use and land cover maps, which are essential for assessing areas at risk of sinkhole formation (Li et al., 2019).

High-resolution satellite imagery also enables time-series analysis, which can track changes in land use and land cover over time. Such analysis is crucial for identifying trends and patterns that contribute to sinkhole development, including urban expansion, deforestation, and alterations in groundwater extraction practices (Wu et al., 2015).

3. Incorporation of Additional Spatial Variables

In addition to the factors considered in the current study—lithology, groundwater decline, soil type, land use, and proximity to groundwater wells—incorporating topographical factors such as slope, elevation, and aspect could provide additional insights. These topographical variables often influence water drainage and soil stability, both of which are important in sinkhole formation (Gao et al., 2014).

Furthermore, integrating detailed hydrological modeling into the GIS analysis could enhance our understanding of how water movement through the landscape affects sinkhole susceptibility. Simulating scenarios of heavy rainfall or prolonged drought could provide valuable information on their impact on groundwater levels and sinkhole risk (Beven & Kirkby, 1979).

4. Improved Data Integration and Validation Techniques

A more comprehensive GIS framework that integrates diverse datasets—such as geological surveys, hydrological models, and remote sensing data—would facilitate a thorough analysis of sinkhole risk. Utilizing machine learning techniques could further help in identifying complex patterns and interactions among various factors that contribute to sinkhole formation (Hengl et al., 2015).

Expanding the sinkhole inventory and performing rigorous cross-validation of the model would enhance its reliability. Incorporating data from other regions with similar geological and environmental conditions could also test the model’s generalizability and robustness (Chen et al., 2020).

5. Exploring Alternative Multicriteria Decision-Making (MCDM) Techniques

The Fuzzy AHP method could bolster the robustness of the susceptibility model by addressing the uncertainty and vagueness inherent in geological and hydrological data. This technique provides a way to incorporate and manage these uncertainties in decision-making processes (Saaty, 2008).

The Weight of Evidence (WoE) method is another promising approach, particularly for binary classification problems such as identifying areas prone to sinkholes. WoE calculates the probability of sinkhole occurrence based on the presence or absence of certain factors, offering a probabilistic perspective on risk assessment (Bonham-Carter, 1994).

Conclusion

The study by Rosdi et al. (2017) significantly advanced our understanding of sinkhole susceptibility in Kuala Lumpur and Ampang Jaya. However, the integration of advanced GIS methods such as Geographically Weighted Regression (GWR), high-resolution remote sensing data, and additional spatial variables holds the potential to further enhance the accuracy and utility of sinkhole susceptibility models. By exploring these and other advanced techniques, future research could provide more reliable tools for predicting and mitigating sinkhole hazards, contributing to safer and more resilient urban environments.

References

Bonham-Carter, G. F. (1994). Geographic Information Systems for Geoscientists: Modelling with GIS. Pergamon Press.

Beven, K. J., & Kirkby, M. J. (1979). A physically-based variable contributing area model of basin hydrology. Hydrological Sciences Bulletin, 24(1), 43-69.

Brunsdon, C., Fotheringham, A. S., & Charlton, M. (1996). Geographically weighted regression: A method for exploring spatial nonstationarity. Geographical Analysis, 28(4), 281-298.

Chen, C., Wu, J., & Zhang, Y. (2020). Enhancing sinkhole susceptibility mapping with deep learning: A case study in southern China. Environmental Monitoring and Assessment, 192(9), 1-15.

Fotheringham, A. S., Brunsdon, C., & Charlton, M. (2002). Geographically Weighted Regression: The Analysis of Spatially Varying Relationships. Wiley.

Gao, J., Wang, H., & Zhao, J. (2014). A new approach to sinkhole susceptibility mapping using GIS and remote sensing techniques. Environmental Earth Sciences, 71(6), 2721-2734.

Hengl, T., de Jesus, J. M., Heuvelink, G. B. M., & Kempen, B. (2015). SoilGrids250m: Global soil information based on machine learning. PLoS ONE, 10(9), e0134086.

Li, J., Li, X., & Lu, S. (2019). An improved method for land use/cover classification using high-resolution remote sensing imagery. Remote Sensing, 11(11), 1302.

Rosdi, M. A. H. M., Othman, A. N., Zubir, M. A. M., Latif, Z. A., & Yusoff, Z. M. (2017). Sinkhole susceptibility hazard zones using GIS and analytical hierarchical process (AHP): A case study of Kuala Lumpur and Ampang Jaya. International Archives of the Photogrammetry, Remote Sensing and Spatial Information Sciences, XLII-4/W5, 145–151. https://doi.org/10.5194/isprs-archives-XLII-4-W5-145-2017

Saaty, T. L. (2008). Decision Making with the Analytic Hierarchy Process. Springer.

Understanding Sinkhole Susceptibility in Kuala Lumpur and Ampang Jaya: A GIS and AHP-Based Approach

Sinkhole Risk Mapping with GIS and AHP: Kuala Lumpur and Ampang Jaya Case Study

Introduction

Sinkholes are a significant geohazard, particularly in urban areas like Kuala Lumpur and Ampang Jaya, where the increasing number of incidents has raised concerns over public safety and urban infrastructure. Since 1968, the Klang Valley region has witnessed a growing frequency of sinkholes, posing serious threats to human lives, assets, and structures, particularly in Malaysia’s bustling capital. To address this issue, Rosdi et al. (2017) conducted a study that employed Geographic Information Systems (GIS) integrated with the Analytical Hierarchical Process (AHP) to develop a Sinkhole Hazard Model (SHM). This article discusses the findings of this study, the methods used, and the potential for future research in this critical area of disaster management.

Sinkhole Susceptibility Hazard Zonation

The SHM developed by Rosdi et al. (2017) categorizes the study area into five zones of sinkhole susceptibility: very low, low, moderate, high, and very high hazard. These classifications are based on a combination of five key criteria: Lithology (LT), Groundwater Level Decline (WLD), Soil Type (ST), Land Use (LU), and Proximity to Groundwater Wells (PG). By assigning relative weights to each of these factors through expert judgment and a pairwise comparison matrix, the study produced susceptibility maps that highlight areas at greatest risk.

The results, depicted in the sinkhole susceptibility hazard zonation maps, show that 31% of the study area falls within the high hazard zone, while 10% is classified as very high hazard. These high-risk zones are predominantly located in the North West part of Kuala Lumpur, an area characterized by Kuala Lumpur Limestone Formation bedrock geology, consisting mainly of limestone/marble and acid intrusive lithology. This geological setting, combined with high levels of groundwater level decline, makes these areas particularly prone to sinkhole development.

GIS and AHP Integration

The integration of GIS and AHP in this study allowed for a systematic and spatially explicit assessment of the factors contributing to sinkhole formation. AHP, in particular, facilitated the weighting of different factors, enabling the researchers to rank the susceptibility of different areas accurately. The susceptibility maps generated from this model provide valuable insights into the spatial distribution of sinkhole hazards, helping urban planners and decision-makers prioritize areas for monitoring and mitigation efforts.

Validation and Model Accuracy

Rosdi et al. (2017) validated their model using a dataset of 33 previous sinkhole events. The validation results were promising, with 64% of the sinkhole events falling within the high hazard zones and 21% within the very high hazard zones. This strong correlation between the model’s predictions and actual sinkhole occurrences demonstrates the effectiveness of the AHP approach in predicting sinkhole hazards.

Limitations and Future Research

Despite the success of the SHM, the study acknowledges several limitations and suggests avenues for future research. One key limitation is the reliance on the AHP technique, which, while effective, may not capture the full complexity of the factors influencing sinkhole formation. The study recommends exploring alternative multi-criteria decision-making techniques, such as Fuzzy AHP, Weight of Evidence (WoE), and other methods that could potentially improve the accuracy of sinkhole susceptibility models.

Another limitation is related to data acquisition, particularly regarding geological and hydrological data. The study suggests that high-resolution satellite imagery could be used to update land use and land cover data, providing a more accurate and timely assessment of sinkhole risk. Additionally, the study highlights the importance of understanding the triggering effects of sinkholes, such as heavy rainfall and excessive groundwater extraction, which could be incorporated into future models.

Finally, the study recommends the computation of the magnitude and frequency relationship of sinkholes as a valuable technique for predicting the likelihood of future sinkhole occurrences. By analyzing the size and frequency of past sinkholes, researchers could better estimate the risk of future events, providing a more comprehensive tool for risk assessment and urban planning.

Conclusion

The study by Rosdi et al. (2017) represents a significant contribution to the understanding of sinkhole susceptibility in Kuala Lumpur and Ampang Jaya. The integration of GIS and AHP allowed for a detailed and spatially explicit analysis of the factors contributing to sinkhole formation, resulting in highly accurate susceptibility maps. However, the study also highlights the need for further research to refine these models and improve the accuracy of sinkhole risk assessments. By exploring alternative techniques and addressing the limitations identified, future studies could provide even more reliable tools for predicting and mitigating sinkhole hazards in urban areas. This ongoing research is crucial for safeguarding urban infrastructure and protecting the lives of those living in sinkhole-prone regions.

References

Rosdi, M. A. H. M., Othman, A. N., Zubir, M. A. M., Latif, Z. A., & Yusoff, Z. M. (2017). Sinkhole susceptibility hazard zones using GIS and analytical hierarchical process (AHP): A case study of Kuala Lumpur and Ampang Jaya. International Archives of the Photogrammetry, Remote Sensing and Spatial Information Sciences, XLII-4/W5, 145–151. https://doi.org/10.5194/isprs-archives-XLII-4-W5-145-2017

Unveiling the Secrets of Mangrove Ecosystems: The Importance of Mapping Mangrove Trees and Their Habitat

By Shahabuddin Amerudin

Mangrove forests are remarkable ecosystems that thrive along coastlines, bridging the gap between land and sea. These biodiverse habitats provide critical ecological services, such as coastal protection, carbon sequestration, and supporting diverse marine life. To effectively conserve and manage mangrove forests, it is crucial to understand their distribution, structure, and dynamics. This is where mapping mangrove trees and their habitat using Geographic Information System (GIS) technology plays a pivotal role. In this article, we will explore the profound importance of mapping mangrove trees and their habitat and how GIS serves as a valuable tool for developing databases, visualization, and analysis.

  1. Comprehensive Data Collection and Integration: GIS enables the collection and integration of diverse data sources related to mangrove ecosystems. Remote sensing techniques, such as satellite imagery and aerial photography, provide high-resolution spatial data, capturing the extent and changes in mangrove cover over time. Field surveys, including vegetation sampling and soil analysis, complement remote sensing data, offering detailed information on mangrove species composition, health, and habitat characteristics. GIS facilitates the harmonization and synthesis of these data, creating comprehensive databases for informed decision-making.
  2. Spatial Analysis and Modeling: GIS empowers researchers and conservationists to conduct sophisticated spatial analysis and modeling, unraveling intricate patterns and relationships within mangrove ecosystems. By employing geospatial tools and algorithms, GIS helps identify suitable mangrove habitat areas, assess ecological connectivity, and analyze the impact of environmental factors on mangrove growth and regeneration. Spatial modeling techniques enable the prediction of future changes, facilitating proactive conservation planning and management strategies.
  3. Visualization and Communication: One of the key strengths of GIS is its ability to transform complex data into visually compelling maps, charts, and graphs. Through GIS-based visualization, intricate patterns and trends in mangrove distribution, species composition, and ecosystem services can be effectively communicated to stakeholders, policymakers, and the wider public. Engaging visualizations help raise awareness about the ecological importance of mangroves and facilitate informed decision-making for conservation and sustainable management.
  4. Decision Support Systems: GIS serves as a powerful tool for decision support in mangrove management. By integrating spatial data with relevant socio-economic and environmental data, GIS aids in identifying priority areas for conservation, planning restoration initiatives, and managing potential conflicts between different land uses. GIS-based decision support systems enable stakeholders to evaluate trade-offs, explore alternative scenarios, and make well-informed decisions, considering the complex interactions within the mangrove ecosystem.
  5. Monitoring and Assessment: The dynamic nature of mangrove ecosystems necessitates continuous monitoring and assessment. GIS, combined with remote sensing technologies, allows for systematic monitoring of mangrove extent, health, and changes in vegetation cover. By comparing historical and current data, GIS facilitates the identification of areas at risk, supports early warning systems for ecosystem degradation, and aids in adaptive management strategies. GIS-based monitoring ensures timely interventions and guides conservation efforts.
  6. Collaboration and Data Sharing: GIS promotes collaboration and data sharing among researchers, policymakers, and local communities involved in mangrove conservation and management. By providing a centralized platform for storing, accessing, and analyzing spatial data, GIS facilitates the exchange of information, knowledge, and best practices. It encourages interdisciplinary collaboration and supports participatory approaches, fostering a holistic understanding of mangrove ecosystems and enabling coordinated conservation efforts.

Mapping mangrove trees and their habitat using GIS is a vital component of effective mangrove conservation and management. GIS technology enables the collection, integration, analysis, and visualization of spatial data, offering valuable insights into the distribution, structure, and dynamics of mangrove ecosystems. By harnessing the power of GIS, we can make informed decisions, implement proactive conservation measures, and ensure the sustainable use and protection of mangrove forests.

Through comprehensive data collection and integration, GIS allows us to gather information from various sources and create robust databases that capture the complexity of mangrove ecosystems. The spatial analysis and modeling capabilities of GIS enable us to uncover patterns and relationships within mangrove habitats, facilitating informed decision-making. The visualization tools provided by GIS help communicate the ecological significance of mangroves to a wider audience, fostering awareness and support for their conservation.

Furthermore, GIS serves as a powerful decision support system, assisting in the identification of priority areas for conservation, restoration, and sustainable management. By integrating socio-economic and environmental data, stakeholders can assess the trade-offs associated with different land uses and develop strategies that promote both ecological integrity and community well-being.

The monitoring and assessment capabilities of GIS are crucial for tracking changes in mangrove extent, health, and biodiversity. By comparing past and present data, we can identify areas under threat and implement timely interventions to mitigate degradation. GIS-based monitoring also enables adaptive management, allowing us to respond effectively to the dynamic nature of mangrove ecosystems and climate change impacts.

Additionally, GIS fosters collaboration and data sharing among stakeholders involved in mangrove conservation. It provides a common platform for researchers, policymakers, and local communities to access and analyze spatial data, promoting interdisciplinary collaboration and participatory approaches. By sharing knowledge and best practices, we can develop effective conservation strategies that consider local contexts and empower communities in the decision-making process.

In conclusion, mapping mangrove trees and their habitat using GIS is essential for understanding, conserving, and sustainably managing these valuable ecosystems. GIS technology provides the tools necessary to collect, analyze, visualize, and communicate spatial data, enabling informed decision-making and proactive conservation efforts. By leveraging GIS capabilities, we can protect mangroves, preserve biodiversity, and secure the myriad ecological services they provide. Embracing GIS as a valuable tool in mangrove conservation is a critical step towards safeguarding these unique and vital habitats for present and future generations.

Suggestion for Citation:
Amerudin, S. (2023). Unveiling the Secrets of Mangrove Ecosystems: The Importance of Mapping Mangrove Trees and Their Habitat. [Online] Available at: https://people.utm.my/shahabuddin/?p=6406 (Accessed: 2 June 2023).

Mapping Flood Risk Around the World: Which Countries and Populations are Most Vulnerable?

By Shahabuddin Amerudin

The above figure shows the risk of flooding mapped around the world (Conte, 2022). The study uses data from Nature to map flood risks around the world and identifies countries and populations vulnerable to the risk of flooding (Rentschler et. al, 2022). The methodology includes both inland and coastal flooding risks. The Netherlands and Bangladesh have more than half of their population at risk due to flooding, followed by Vietnam, Egypt, and Myanmar. The Southeast Asia region makes up more than two-thirds of the global population exposed to flooding risk. China and India account for the highest absolute number of people at risk of rising water levels. Pakistan is particularly vulnerable to floods, with 31% of its population (72 million people) at risk of flooding. Flooding is already affecting countries like Pakistan, and the rising human toll is a major concern. Floods also bring with them massive economic costs, and the forecasted water risk caused by floods, droughts, and storms could eat up $5.6 trillion of global GDP by 2050.

Rentschler et. al (2022) reveals that coastal and riverine countries with flatlands are the most vulnerable to the risk of flooding. It highlights the need for these countries to prepare and develop effective flood management plans to mitigate the impact of flooding. Countries like Bangladesh have already been developing innovative solutions like floating hospitals, schools, and homes, to cope with the increased risk of flooding. Such solutions could be adopted by other countries to deal with the risks associated with flooding.

Conte (2022) emphasizes the need for urgent action to address the increasing risk of flooding. The rising human toll and the massive economic costs caused by flooding highlight the urgency of developing effective flood management plans. Governments and policymakers need to prioritize climate action and allocate sufficient resources to manage the risks associated with flooding. Such measures would require international cooperation, particularly in developing countries that lack the necessary resources and technology to deal with the impact of flooding.

In conclusion, Conte (2022) presents an analysis of the risk of flooding mapped around the world. It highlights the countries and populations most vulnerable to flooding, the impact of flooding on human life and the economy, and the urgent need for action to address the issue. The study calls for innovative solutions, international cooperation, and sufficient resources to develop effective flood management plans to mitigate the risks associated with flooding.

References:

Conte, N. (2022). Mapped: Countries with the Highest Flood Risk. Retrieved from: https://elements.visualcapitalist.com/mapped-countries-with-the-highest-flood-risk/

Rentschler, J., Salhab, M. & Jafino, B.A. Flood exposure and poverty in 188 countries. Nat Commun 13, 3527 (2022). https://doi.org/10.1038/s41467-022-30727-4

Suggestion for Citation:
Amerudin, S. (2023). Mapping Flood Risk Around the World: Which Countries and Populations are Most Vulnerable? [Online] Available at: https://people.utm.my/shahabuddin/?p=6352 (Accessed: 15 April 2023).

Advancements and Challenges in Hazard and Risk Mapping

By Shahabuddin Amerudin

Introduction

Hazard and risk mapping has become an increasingly important tool in disaster management, providing decision-makers with critical information about potential hazards and risks in their communities. These maps help to identify areas that are most vulnerable to natural disasters, and to develop effective strategies for mitigation and response.

The history of hazard and risk mapping dates back to the early 20th century, when scientists began to study the impact of natural disasters on communities. Over time, the field has evolved to incorporate new technologies and data sources, as well as a greater emphasis on social and economic factors that contribute to vulnerability.

Today, there are many types of hazard and risk maps available, each with their own unique benefits and limitations. Some of the most common types include flood maps, earthquake maps, wildfire maps, and hurricane maps. These maps can be used to identify areas that are most at risk for a particular hazard, and to develop mitigation and response strategies tailored to the specific needs of each community.

In recent years, there has been a growing emphasis on developing more comprehensive and inclusive hazard and risk maps. This includes maps that incorporate social and economic factors, such as poverty, race, and access to resources, which can contribute to vulnerability during disasters. There are also emerging types of maps, such as dynamic risk maps, multi-hazard maps, social vulnerability maps, and participatory mapping, which aim to provide more nuanced and detailed information about hazards and risks.

Advancements in Hazard and Risk Mapping

Hazard and risk mapping has come a long way since its inception, with significant advancements in technology, data collection, modeling, and analysis. In recent years, there has been a growing emphasis on incorporating social and economic factors into hazard and risk maps, as well as the development of emerging types of maps that provide more nuanced and detailed information about hazards and risks.

One of the key advancements in hazard and risk mapping is the use of advanced technology and tools for data collection, modeling, and analysis. Geographic Information Systems (GIS) have become increasingly important in the creation of hazard and risk maps, allowing for the integration of a wide range of data sources, including satellite imagery, aerial photographs, and ground-based sensors. Other technologies, such as LiDAR, remote sensing, and machine learning, have also been used to improve the accuracy and resolution of hazard and risk maps.

Another important advancement in hazard and risk mapping is the incorporation of social and economic factors into these maps. While early hazard and risk maps focused primarily on physical factors, such as topography and land use, there is now a growing recognition of the importance of social and economic factors, such as poverty, race, and access to resources. Incorporating these factors into hazard and risk maps can provide decision-makers with a more comprehensive and inclusive view of vulnerability, and help to identify areas that are most at risk during disasters.

There are also emerging types of maps that are contributing to more comprehensive and inclusive views of hazards and risks. Dynamic risk maps, for example, provide real-time information about changing hazards and risks, such as wildfires or floods, allowing for more effective response and mitigation efforts. Multi-hazard maps combine information about multiple hazards, such as earthquakes and tsunamis, to provide a more comprehensive view of risk. Social vulnerability maps highlight areas that are most vulnerable to disasters based on factors such as income, race, and access to resources. Participatory mapping involves engaging local communities in the mapping process, allowing them to contribute their own knowledge and perspectives on hazards and risks.

Overall, the advancements in hazard and risk mapping are helping to build more resilient communities and reduce the impact of natural disasters. By incorporating social and economic factors into these maps, and developing new types of maps that provide more comprehensive and inclusive views of hazards and risks, decision-makers can make more informed decisions and develop more effective mitigation and response strategies.

Challenges in Hazard and Risk Mapping

Hazard and risk mapping is a critical tool in disaster management, providing decision-makers with critical information to assess and mitigate potential risks. However, there are several challenges associated with hazard and risk mapping that need to be addressed to improve their effectiveness.

One of the key challenges is data quality and availability. Hazard and risk mapping relies on accurate and up-to-date data from a range of sources, including satellite imagery, remote sensing, and ground-based sensors. However, there are often gaps in data availability, particularly in developing countries, which can lead to inaccurate or incomplete hazard and risk maps. Additionally, the quality of data can vary widely, making it difficult to compare and integrate data from different sources.

Another challenge is modeling accuracy. Hazard and risk maps rely on complex modeling techniques to assess the likelihood and impact of potential hazards. However, these models are often based on simplified assumptions and can be impacted by uncertainties in the data. This can lead to inaccurate or incomplete hazard and risk maps that do not reflect the true risks to communities.

Effective communication and engagement with communities is also a challenge in hazard and risk mapping. While hazard and risk maps can provide valuable information to decision-makers, they are often complex and difficult for the public to understand. This can lead to a lack of trust in the maps and a failure to take appropriate action to mitigate risks. Additionally, there can be cultural or linguistic barriers that prevent effective communication and engagement with some communities.

To address these challenges, ongoing efforts are needed to improve hazard and risk mapping. Data sharing initiatives can help to improve data quality and availability by making data more accessible to a wider range of users. Better modeling and analysis tools, including advanced technologies such as machine learning, can help to improve the accuracy of hazard and risk maps. Improved communication and engagement strategies, such as the use of participatory mapping and community-based approaches, can help to ensure that hazard and risk maps are understood and trusted by the communities they are designed to serve.

Conclusion

Hazard and risk mapping has come a long way since its inception, evolving in response to advances in technology, data collection, modeling, and analysis. While traditional hazard and risk maps are still valuable tools in disaster management, emerging types of maps, such as dynamic risk maps, multi-hazard maps, social vulnerability maps, and participatory mapping, are contributing to more comprehensive and inclusive views of hazards and risks.

However, despite the progress made in hazard and risk mapping, there are still several challenges that need to be addressed. Issues related to data quality and availability, modeling accuracy, and communication and engagement with communities continue to pose significant obstacles. Addressing these challenges will require ongoing efforts to improve hazard and risk mapping, including data sharing initiatives, better modeling and analysis tools, and improved communication and engagement strategies.

In conclusion, hazard and risk mapping is a crucial component of disaster management, providing decision-makers with the information they need to prepare for, respond to, and recover from disasters. As such, it is essential that policymakers, researchers, and practitioners continue to advance hazard and risk mapping to better support decision-making and disaster resilience. By working together, we can create more accurate, reliable, and accessible hazard and risk maps that can help build more resilient and sustainable communities.

Suggestion for Citation:
Amerudin, S. (2023). Advancements and Challenges in Hazard and Risk Mapping. [Online] Available at: https://people.utm.my/shahabuddin/?p=6208 (Accessed: 31 March 2023).

APIs and SDKs for Indoor Mapping

There are several APIs and SDKs available that can be used for developing web mapping applications that can detect whether a user is inside a building. Here are a few examples:

  1. Google Maps Indoor Maps API: The Google Maps Indoor Maps API provides developers with access to indoor maps and location data for thousands of buildings around the world. The API can be used to display indoor maps, search for locations within a building, and provide directions between different points within a building.

  2. IndoorAtlas SDK: IndoorAtlas is an indoor positioning system that provides developers with an SDK for integrating indoor location tracking into their applications. The SDK uses a combination of WiFi, Bluetooth, and magnetic field data to provide accurate indoor location information, and can be used to build a wide range of indoor navigation and tracking applications.

  3. Mapbox Indoor Mapping SDK: Mapbox provides an indoor mapping SDK that can be used to create custom indoor maps and floor plans, as well as to track and display a user’s location within a building. The SDK can be used to build a wide range of indoor navigation and tracking applications, and provides support for both iOS and Android platforms.

  4. Esri Indoors SDK: Esri provides an Indoors SDK that can be used to build indoor maps and location tracking applications using the Esri ArcGIS platform. The SDK provides a range of features, including support for indoor routing, 3D visualization, and location tracking using Bluetooth beacons.

These are just a few examples of the many APIs and SDKs available for developing web mapping applications that can detect whether a user is inside a building. Whether you choose a commercial or open source solution will depend on your specific needs and budget.

There are several free and open source APIs and SDKs available for developing web mapping applications that can detect whether a user is inside a building. Here are a few examples:

  1. OpenIndoor: OpenIndoor is an open source project that provides indoor maps and location tracking data for a variety of buildings around the world. The project includes an API and SDK that can be used to build indoor mapping and navigation applications.

  2. OpenLayers: OpenLayers is a free and open source JavaScript library for building web mapping applications. The library includes support for indoor mapping and can be used to build applications that display indoor maps and location data.

  3. Leaflet Indoor: Leaflet Indoor is a plugin for the Leaflet JavaScript mapping library that provides support for indoor mapping and location tracking. The plugin includes features such as indoor markers, zoom levels, and map layers, and can be used to build a variety of indoor mapping and navigation applications.

  4. GeoServer: GeoServer is a free and open source server for sharing geospatial data. The software includes support for indoor mapping and can be used to serve indoor maps and location data to web mapping applications.

These are just a few examples of the many free and open source APIs and SDKs available for developing web mapping applications that can detect whether a user is inside a building. By leveraging these tools, developers can build powerful mapping applications without the need for expensive proprietary software.

Web Mapping Application to Detect Indoor User

Developing a web mapping application that can detect a user is inside a building requires a few different components, including accurate building data and the ability to determine a user’s location. Here are some steps you can follow to develop such an application:

  1. Collect and integrate building data: You’ll need accurate data on the buildings in your area of interest, including their floor plans and dimensions. This data can be obtained from public sources or from private companies that specialize in mapping and building data. Once you have the data, you’ll need to integrate it into your mapping application.

  2. Determine a user’s location: To determine whether a user is inside a building, you’ll need to be able to determine their location with some degree of accuracy. There are several ways to do this, including GPS, WiFi positioning, and Bluetooth beacons. Each of these methods has its strengths and weaknesses, so you’ll need to choose the one that works best for your application.

  3. Use algorithms to match a user’s location with building data: Once you have a user’s location, you’ll need to use algorithms to match their location with the building data you’ve collected. This can be done using techniques such as geofencing, which involves creating a virtual boundary around a building, or using indoor positioning systems that can accurately determine a user’s location within a building.

  4. Display the user’s location on a map: Finally, you’ll need to display the user’s location on a map so that they can see where they are relative to the building. This can be done using a variety of mapping tools, including Google Maps, Leaflet, and Mapbox.

When developing a web mapping application that can detect whether a user is inside a building, one important step is to use algorithms to match the user’s location with the building data you have collected. This involves using sophisticated techniques to analyze the user’s location data and compare it to the building data in order to determine whether the user is inside the building.

There are several different approaches that can be used to match a user’s location with building data, including geofencing, indoor positioning systems, and machine learning algorithms.

Geofencing involves creating a virtual boundary around a building, such as a polygon or circle, and then checking whether the user’s location falls within that boundary. This can be done using GPS coordinates or other location tracking methods, and is a relatively simple approach that can be effective for some applications.

Indoor positioning systems, on the other hand, are designed specifically to determine a user’s location within a building. These systems typically use a combination of WiFi, Bluetooth, or other signals to triangulate the user’s location, and can be accurate to within a few meters. Indoor positioning systems can be expensive to implement, but can provide very accurate location data that is essential for some applications.

Finally, machine learning algorithms can be used to analyze a user’s location data and compare it to building data in order to determine whether the user is inside a building. These algorithms can be trained on large datasets of location and building data, and can learn to identify patterns and relationships between the data that can be used to make accurate predictions about a user’s location.

Overall, developing a web mapping application that can detect a user is inside a building requires a combination of accurate data, location tracking technology, and sophisticated algorithms. By following these steps, you can create a powerful mapping tool that can help users navigate indoor spaces more effectively. The key to matching a user’s location with building data is to use a combination of techniques that are appropriate for your specific application. By leveraging the latest technologies and algorithms, you can create a powerful web mapping application that can help users navigate indoor spaces more effectively.

10 Python Libraries for GIS and Mapping

Python Libraries for GIS and Mapping

Python libraries are the ultimate extension in GIS because it allows you to boost its core functionality.

By using Python libraries, you can break out of the mould that is GIS and dive into some serious data science.

There are 200+ standard libraries in Python. But there are thousands of third-party libraries too. So, it’s endless how far you can take it.

Today, it’s all about Python libraries in GIS. Specifically, what are the most popular Python packages that GIS professionals use today? Let’s get started.

First, why even use Python libraries for GIS?

Have you ever noticed how GIS is missing that one capability you need it to do? Because no GIS software can do it all, Python libraries can add that extra functionality you need.

Put simply, a Python library is code someone else has written to make life easier for the rest of us. Developers have written open libraries for machine learning, reporting, graphing and almost everything in Python.

If you want this extra functionality, you can leverage those libraries by importing them in your Python script. From here, you can call functions that aren’t natively part of your core GIS software.

PRO TIP: Use pip to install and manage your packages in Python

Python Libraries for GIS

If you’re going to build an all-star team for GIS Python libraries, this would be it. They all help you go beyond the typical managing, analyzing and visualizing of spatial data. That is the true definition of a geographic information system.

1 Arcpy

If you use Esri ArcGIS, then you’re probably familiar with the ArcPy library. ArcPy is meant for geoprocessing operations. But it’s not only for spatial analysis, but it’s also for data conversion, management and map production with Esri ArcGIS.

2 Geopandas

Geopandas is like pandas meet GIS. But instead of straight-forward tabular analysis, the geopandas library adds a geographic component. For overlay operations, geopandas uses Fiona and Shapely, which are Python libraries of their own.

3 GDAL/OGR

The GDAL/OGR library is used for translating between GIS formats and extensions. QGIS, ArcGIS, ERDAS, ENVI and GRASS GIS and almost all GIS software use it for translation in some way. At this time, GDAL/OGR supports 97 vector and 162 raster drivers.

GIS Formats Conversions

4 RSGISLib

The RSGISLib library is a set of remote sensing tools for raster processing and analysis. To name a few, it classifies, filters and performs statistics on imagery. My personal favourite is the module for object-based segmentation and classification (GEOBIA).

5 PyProj

The main purpose of the PyProj library is how it works with spatial referencing systems. It can project and transform coordinates with a range of geographic reference systems. PyProj can also perform geodetic calculations and distances for any given datum.

Python Libraries for Data Science

Data science extracts insights from data. It takes data and tries to make sense of it, such as by plotting it graphically or using machine learning. This list of Python libraries can do exactly this for you.

6 NumPy

Numerical Python (NumPy library) takes your attribute table and puts it in a structured array. Once it’s in a structured array, it’s much faster for any scientific computing. One of the best things about it is how you can work with other Python libraries like SciPy for heavy statistical operations.

7 Pandas

The Pandas library is immensely popular for data wrangling. It’s not only for statisticians. But it’s incredibly useful in GIS too. Computational performance is key for pandas. The success of Pandas lies in its data frame. Data frames are optimized to work with big data. They’re optimized to such a point that it’s something that Microsoft Excel wouldn’t even be able to handle.

8 Matplotlib

When you’re working with thousands of data points, sometimes the best thing to do is plot it all out. Enter matplotlib. Statisticians use the matplotlib library for visual display. Matplotlib does it all. It plots graphs, charts and maps. Even with big data, it’s decent at crunching numbers.

matplotlib

9 Scikit

Lately, machine learning has been all the buzz. And with good reason. Scikit is a Python library that enables machine learning. It’s built in NumPy, SciPy and matplotlib. So, if you want to do any data mining, classification or ML prediction, the Scikit library is a decent choice.

10 Re (regular expressions)

Regular expressions (Re) are the ultimate filtering tool. When there’s a specific string you want to hunt down in a table, this is your go-to library. But you can take it a bit further like detecting, extracting and replacing with pattern matching.

11 ReportLab

ReportLab is one of the most satisfying libraries in this list. I say this because GIS often lacks sufficient reporting capabilities. Especially, if you want to create a report template, this is a fabulous option. I don’t know why the ReportLab library falls a bit off the radar because it shouldn’t.

PRO TIP: If you need a quick and dirty list of functions for Python libraries, check out DataCamp’s Cheat Sheets.

Source: https://gisgeography.com/python-libraries-gis-mapping/