
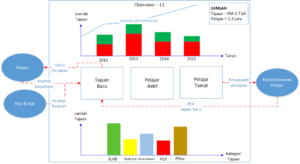
I am using BI Power Tools with custom visualization to develop this (please refer to the overview diagram)
Initially, I’ve found three challenges:
- How to embed the interconnectedness (see the lines with red dotes) within these customize visual diagrams?
- Putting flow to ease the cognitive understanding.
- Tracing the specific information when going to the deeper level ( filter) – in which the current dashboard will go to different pages.