Weather data is temporal data. It changes according to time (hours, day, month or years). Since weather is crucial for us human to do our activities, people forecast it. By having forecast data, it helps business and people plan for their outdoor activities. In Malaysia – it is very crucial during kenduri kahwin, some people still believe and hire ‘bomoh hujan’ to forecast and prevent rain during the wedding day. More over, it helps business plan like transportation, construction and farmers for crop irrigation and protection. Eventhough the weather data in Malaysia is not as crucial as in four season country (since it will not help people on how to dress or either to bring extra coat for windy days) but forecast data can help in term of health issue like asthma and heat stress especially for children’sschool activities.
Since the data for Forecast weather is everywhere – from your own handphone, PC, TV and radio. I think for Haida (since you are from MANA – assurance course), it is time for us to check the accuracy between the forecast data and the real one. It will help to prove the accuracy of Jabatan Meteorologi Data. If the comparison has been done, why dont we visualize the comparison to ease the forecast data understanding.
Thus, the objectives for Haida research can be something like this
- Compare between forecast and real set of weather data.
- Visualize the comparison
- Identify the accuracy of the forecast data – reliability/assurance of the data OR maybe we can access how people trust/ the data? (hmm.. this can give awareness about the credibility of jabatan meteorologi data)
In order to do that, what you need to do this week is:
- Identify and get the forecast and real set of weather data (try to get a set for 10 days first)
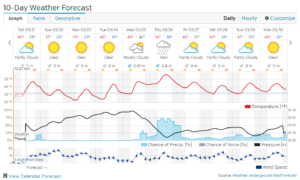
- Type of data – the general one, things like this:

Source: weather underground weather forecast.
- Bring that set of data for our next discussion (17 August 2017).
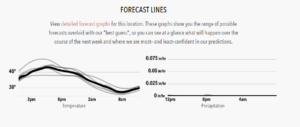
- Have a peek on your expected outcomes, something like this (but not necessarily exact):

- Read and understand this http://stat4701.github.io/edav/2015/03/25/hafiz-weather-1/ – very good to get some ideas for your LR (please explain to me your understanding about this article in our discussion later)


