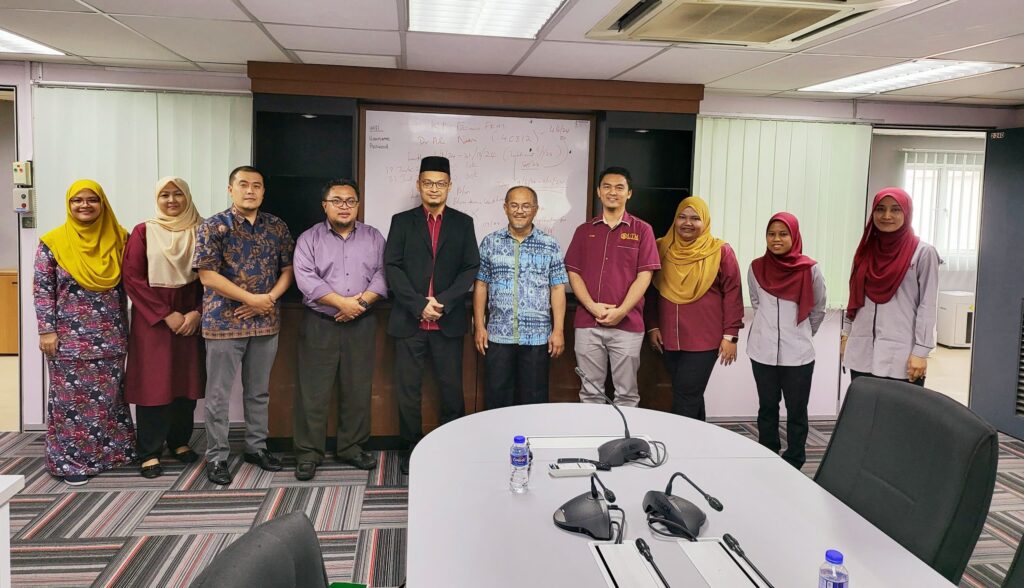
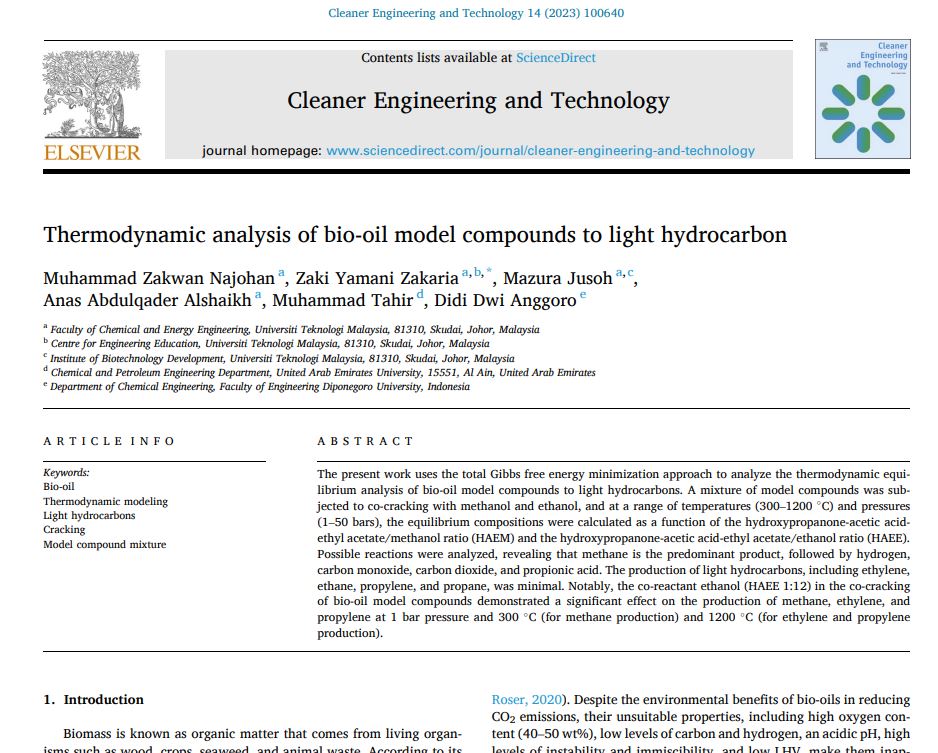
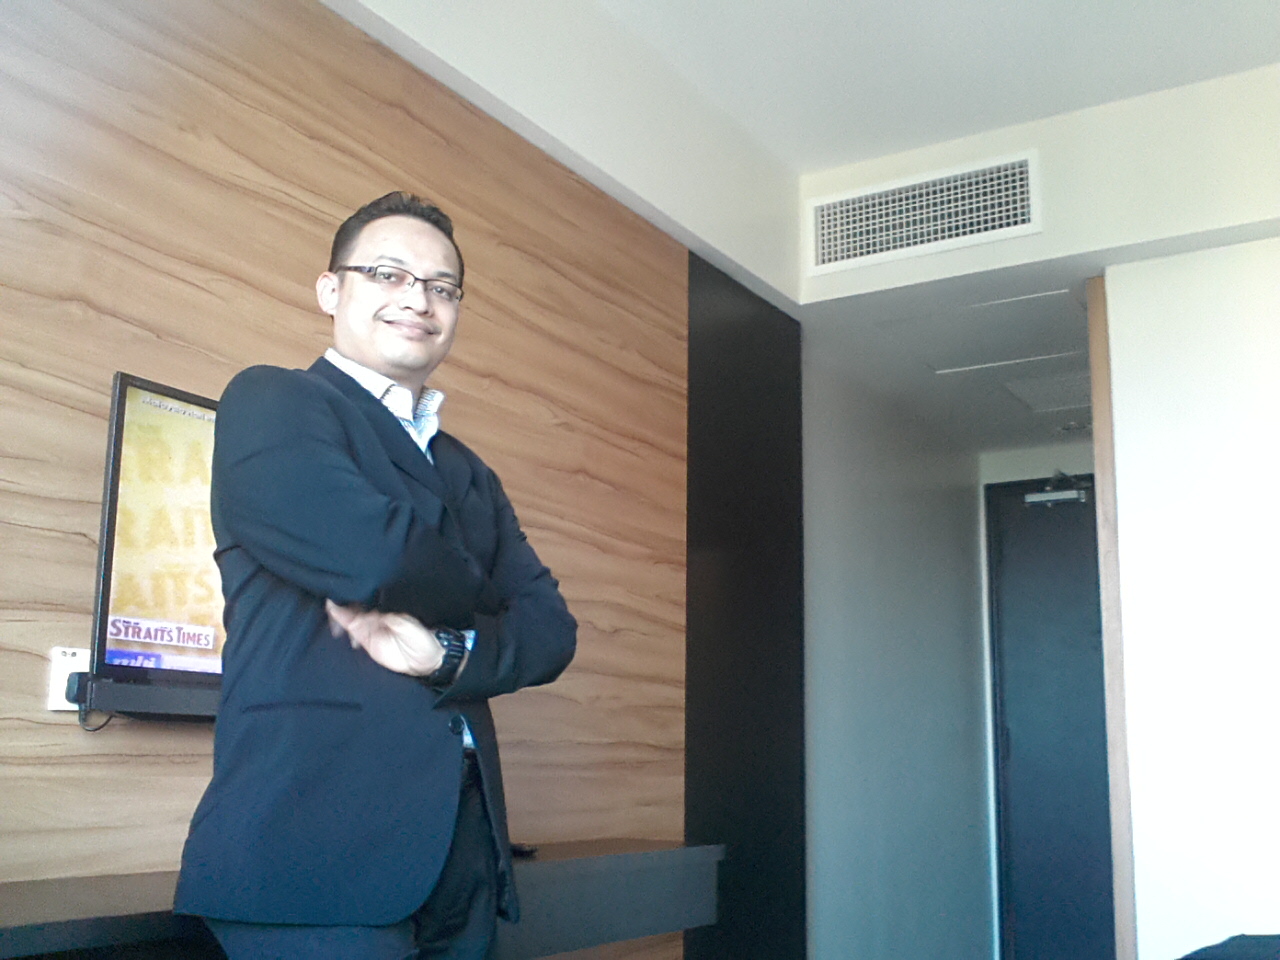
I became one of the examiners/evaluators for this Final Report MKKL Research Project today on an off-day Saturday. The session took place at 11am and ended at 2.45pm. But off course, the day started earlier because we have to read the thesis prepared by the students. The topics of the MKKL Master project are as shown below:
INVESTIGATION ON THE EFFECT OF HYDROGEN FLOW ON ACETYLENE HYDROGENATION PROCESS USING ASPEN HYSYS by ANAS ZHAFRI BIN MAT RAFFEI
and
Encapsulation of andrographolide loaded nanostructured lipid carrier using ultrasonication, by Logavenota A/P Pothan
Example of my Weekly Comments to the Weekly Progress Report Submitted by my Students
Comments for Ziah Er
1) Do you BI and BM abstract
2) Correct your Table of Content Paging
3) Can you adjust Figure 1.1 to be actually cited and discussed under Section 1.1 Reserch Background?
4) 2.3 Catalyst Used in Ethanol Dry Reforming Section – You can also list those catalyst under steam reforming as well.. So that you can get more data. Better tabulate this in table.
5) Under Section 2.9 Ethanol Reforming Process – Its best to include a table of previous researchers who has been working on ethanol production from steam and dry reforming. This Table maybe can combine with the table I mentioned in Point 4 above.
6) For Figure 4.12 to 4.16, Effect of pressure, is your temperature maintained at 800C?
7) Originally I suggested to you do discuss effect of both temperature and pressure in a contour plot. Since you have done this, that’s fine. But you need to justify why you choose the 800C temperature.
8) After this you plot the contour plot ok.
9) Can start prepare presentation slide.
Comments for Zakwan:
1) Remind me to improve your Objective next week.
2) I suggest to include some pictures of bio oil in Section 2.3 or 2.4. And also picture of bio oil after upgrading for Section 2.6.
3) Good job on Table 2.2, but instead of putting SLASH, put a DASH. Also for Table 2.2, you lack data of the recent 5 years (2016-2021) – Where you only have 3 out of 18 references from the more recent 5 years, I suggest you add a bit more on this, atbout half- half… Meaning recent 5 years >50% than all of the ones in Table 2.2. ===== Same issue for Table 2.4. (Good job on the improvement of Table 2.2 and 2.4 compared to before this!!!)
4) Chapter 4 – You are left with the discussion and analysis of the results right… Make sure when you discuss all the Tables and Figures, cite the table and figure accordingly. It must be mentioned. It cannot be left independently alone. The discussion must be before the table or figure appear.
5) Later, you can study effect of pressure and temperature by analysis it in a contoour plot… But choose only the most important and dominant products.
Overall, Greaat Amazing job!!!
Comments for Izz:
1) Change all the starting part of your proposal to your own content, not template content.
2) Extend content of your Abstract.
3) Check issues in your Table of Content.
4) Your references formating are not consistant. At the same time your references are not too much. I did’nt realize this before. Please add more references (especially those of the recent 5 years (2016-2021) so you have more references in Chapter 1 and 2.).
5) Have you actually applied Endnote to your proposal?
6) Can you include picutres of oil sludge in early part of Chapter 2, so we can imagine how it looks like. You can include few photos so we can see the various kinds of sludges. Include references for it as well.
7) Table and Figure Captions throughout the proposal must be corrected. For example, Your existing Table 2.1.1 must be actually Table 2.1, Then yourexisting Table 2.1.2 must be Table 2.2. Your Figure 2.2.1, must be Figure 2.1, then the next figure after that must be Figure 2.2 … All of these are in chapter 2.
If it is in Chapter 3. First figure must be Figure 3.1, followed by Fig 3.2, Fig 3.3 and so on. Table also must be Table 3.1, 3.2 3.3 and so on.
If it is in Chapter 4, It should be labled as Figure 4.1, 4.2, 4.3 and so on.. Table should be labeled as Table 4.1, 4.2, 4.3 and so on… Hope you understand this.
7) All equations must be labelled as well. Check the format how to label it.
8) Chapter 4 – Your figure citation and Figure caption must be corrected for all.
9) Later, you can study effect of pressure and temperature by analysis it in a contoour plot… But choose only the most important and dominant products.