By Shahabuddin Amerudin
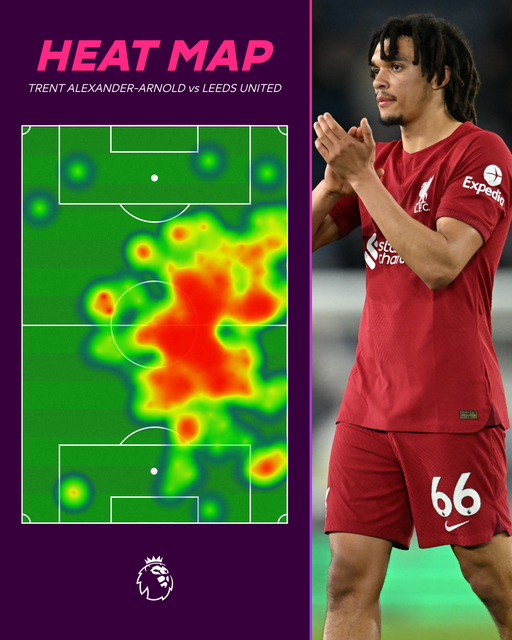
The heatmap serves as a visual representation of the areas on the football pitch where Trent Alexander-Arnold was most active during the match against Leeds United. The intensity of the color on the map reflects the frequency of his presence in specific regions, with warmer colors such as red and orange indicating higher levels of activity, and cooler colors like blue and green suggesting lower levels.
As expected for a right-back, Alexander-Arnold’s heatmap is predominantly concentrated on the right side of the pitch, revealing his primary role in the defensive third. He also occasionally advances into the midfield to support offensive plays. However, what distinguishes him is his significant overlap with Liverpool’s midfielders, highlighting his tendency to push forward and engage in the attack, often initiating plays from deeper positions on the field.
While his offensive contributions are clearly visible, the heatmap also indicates that Alexander-Arnold does not neglect his defensive responsibilities. The presence of activity in his defensive third suggests that he diligently tracks back to assist his fellow defenders or cover spaces left open by attacking players. This balanced approach between attacking and defensive duties is a key feature of his playing style.
Football analysis heatmaps are generated using sophisticated tracking technologies. Players are equipped with GPS devices that monitor their movements on the pitch, capturing data such as distance covered, speed, acceleration, and positioning. Additionally, cameras are employed to record the movements of both players and the ball, yielding high-resolution data that is analyzed to produce heatmaps. Specialized software like ArcGIS or QGIS processes this data to create visualizations.
While the heatmap provides valuable insights into Trent Alexander-Arnold’s activity on the pitch, it does not fully capture the breadth of his performance. To gain a more comprehensive understanding of his contributions, it is essential to analyze additional data, such as his passing statistics, which would reveal the types of passes he makes, their accuracy, and the specific areas he targets.
Furthermore, examining his defensive actions, including the number of tackles, interceptions, and blocks he performs, would offer a clearer picture of his defensive capabilities. Additionally, his offensive contributions, such as the number of assists, goals, and key passes he generates, are crucial for understanding his impact in attack. By integrating this data with the heatmap, a more detailed and nuanced evaluation of Alexander-Arnold’s overall performance can be achieved.
