Working memory overload

Why cant I remember my precious memory?
Surfing web here and there, playing video games for 8 hours, facebooking and on the phone all the time make information overload —> working memory overload.

Working memory is responsible for:
1. Intake information
2. Will power – focus
3. Treating in your life
4. Taking new information and linking with the information you already know
5. Behavior response based on information
6. How to use information in your life

How to reduce working memory overload? —> Digital information diet
1. Eliminate your facebook, handphone and webpages
2. Read real book – 4 months
3. Find quiet time for self-reflection.
Find quiet time –> to become more clarity in thought, talk without run some tangent —> Nabi Muhammad SAW did this too – Gua Hira’ time.

Time is the comodity – technology will take it if you dont control it.

Find more from here: https://www.youtube.com/watch?v=Z0ztO86ImQg

Cognitive Theory

Multimedia Cognitive Learning Theory (Meyer, 2001), basically – there are three assumptions:

1. 2 separate channel for input – audio + visual
2. Limited to 7 elements
3. Active learning – build connectivity between separate channel

Learn more from https://www.youtube.com/watch?v=sP98_CTjXNo

12 Principles for Multimedia Learning Theory

In the book Multimedia Learning (Cambridge Press, 2001), Richard E. Mayer discusses twelve principles that shape the design and organization of multimedia presentations:
1. Coherence Principle – People learn better when extraneous words, pictures, and sounds are excluded rather than included.
2. Signaling Principle – People learn better when cues that highlight the organization of the essential material are added.
3. Redundancy Principle – People learn better from graphics and narration than from graphics, narration and on-screen text.
4. Spatial Contiguity Principle – People learn better when corresponding words and pictures are presented near rather than far from each other on the page or screen.
5. Temporal Contiguity Principle – People learn better when corresponding words and pictures are presented simultaneously rather than successively.
6. Segmenting Principle – People learn better from a multimedia lesson is presented in user-paced segments rather than as a continuous unit.
7. Pre-training Principle – People learn better from a multimedia lesson when they know the names and characteristics of the main concepts.
8. Modality Principle – People learn better from graphics and narration than from animation and on-screen text.
9. Multimedia Principle – People learn better from words and pictures than from words alone.
10. Personalization Principle – People learn better from multimedia lessons when words are in conversational style rather than formal style.
11. Voice Principle – People learn better when the narration in multimedia lessons is spoken in a friendly human voice rather than a machine voice.
12. Image Principle – People do not necessarily learn better from a multimedia lesson when the speaker’s image is added to the screen

https://www.youtube.com/watch?v=0aq2P0DZqEI&t=63s

or here

https://www.youtube.com/watch?v=stJ-MkTgRFs&t=138s

Melati Matamori

Melati Matamori – Bunga ungu dan putih teradun dari satu pokok yang sama. Suci, ikhlas dan nampak sederhana. Harumnya juga lembut dan menenangkan. Adelia Medina dipagi hari bersama melati. Kalau tidak namanya juga ingin mama sunting dari bunga melati – Melati Khaira.


Design Thinking vs Computational Thinking

IDEO defines design thinking as the application of empathy and experimentation to arrive at innovation solutions through making decisions based on stakeholder input and evidence based research. Design thinking attempts to understand the intent or problem before looking at any solution . It emphasize the importance to identify why the problem exists in the first place before solving it.

Using the HOTS for KSSR Level 1, a design thinker would ask, what is the intent of provide HOTS for KSSR Level 1 instead at the first place?

Based on quicksense, (15 August 2017 – https://blog.quicksense.org/design-thinking-vs-computational-thinking-in-education-2dcf5b23aa12), Vivek Kumar clarified the difference between design thinking and computational thinking using simple  a thought experiment: You need to move 10 boxes from one side of town to the other. How would you do it?

As a computational thinker, a set of instructions would be drafted, tested, and the most efficient route would be attained. Questions that would be asked by a computational thinker could include ‘what are the sizes of the boxes, how heavy are they, and is anything fragile’ to best cater for the most effective action.

In design thinking, the primary question would be ‘why do you want to move the box in the first place?’.

To him, the question ‘why do you want to move the box in the first place’ is the most important question. This frames the problem in a whole new light. An interesting finding could include that you specifically do not need to move the box yourself or that there is something inside the box that needs to be moved, and not the box itself. I think that design thinking shapes computational thinking and it is design thinking that needs to be given the highest priority in our education system.

Computational Thinking

Computational thinking is the thought processes involved in formulating a problem and expressing its solution(s) in such a way that a computer—human or machine—can effectively carry out. A few characteristics of CT (this points are especially for K12):

  • Using abstractions and pattern recognition to represent the problem in new and different ways
  • Logically organizing and analyzing data
  • Breaking the problem down into smaller parts
  • Approaching the problem using programmatic thinking techniques such as iteration, symbolic representation, and logical operations
  • Reformulating the problem into a series of ordered steps (algorithmic thinking)
  • Identifying, analyzing, and implementing possible solutions with the goal of achieving the most efficient and effective combination of steps and resources
  • Generalizing this problem-solving process to a wide variety of problems

Computational thinking is made up of four parts:

i. Decomposition.

ii. Pattern recognition.

iii. Pattern generalization

iv.  Abstraction.

The criticism

https://www.wired.com/2016/09/how-to-teach-computational-thinking/ define “computational thinking.”  Its intellectual core is about formulating things with enough clarity, and in a systematic enough way, that one can tell a computer how to do them. Mathematical thinking is about formulating things so that one can handle them mathematically, when that’s possible. Computational thinking is a much bigger and broader story, because there are just a lot more things that can be handled computationally.

But how about when we are in a position when the situation which doesn’t have enough clarity and ill-structured? where the situation is always uncertain and complex? When we try to handle the complex situation using complicated approach – clearly mismatched.

Furthermore, [18] Others worry that the emphasis on Computational Thinking encourages computer scientists to think too narrowly about the problems they can solve, thus avoiding the social, ethical and environmental implications of the technology they create.[19][2]

To handle the complex challenge and the narrow mindset – it is important to incorporate CT with design thinking and systemic thinking.

This is because, design thinking attempts to understand the intent or problem before looking at any solution . It emphasize the importance to identify why the problem exists in the first place before solving it. Incorporating CT with design thinking will help to clarify and frames the problem in a whole new light. By broaden the horizons, an innovative solutions might arise without thinkers terikat dengan specific solution that might be wrong and not effective.

However, being creative without systematic approach might bring the thinkers to nowhere. applying CT, we can bridge ideation into realization.

Phase 1: Identify the Problem

  • Using abstractions and pattern recognition to represent the problem in new and different ways (visualize – sketch using structure).
  • Logically organizing and analyzing data
  • Breaking the problem down into smaller parts


Phase 2: Solution

  • Reformulating the problem into a series of ordered steps (algorithmic thinking)


Phase 3: Evaluation

  • Approaching the problem using programmatic thinking techniques such as iteration, symbolic representation, and logical operations
  • Identifying, analyzing, and implementing possible solutions with the goal of achieving the most efficient and effective combination of steps and resources.
  • Generalizing this problem-solving process to a wide variety of problems? Can it be generalize or not?

Analysis, analytics, trend and forecasting

Analysis Definition:

1. A systematic examination and evaluation of data or information, by breaking it into its component parts to uncover their interrelationships. Opposite of synthesis.
2. An examination of data and facts to uncover and understand cause-effect relationships, thus providing basis for problem solving and decision making.

Analytical Definition:

The field of data analysis. Analytics often involves studying past historical data to research potential trends, to analyze the effects of certain decisions or events, or to evaluate the performance of a given tool or scenario. The goal of analytics is to improve the business by gaining knowledge which can be used to make improvements or changes.

Then from the analytical, come forecasting – the prediction from the past and present trend of analysis.

Forecast Definition:

A planning tool that helps management in its attempts to cope with the uncertainty of the future, relying mainly on data from the past and present and analysis of trends.
Forecasting starts with certain assumptions based on the management’s experience, knowledge, and judgment. These estimates are projected into the coming months or years using one or more techniques such as Box-Jenkins models, Delphi method, exponential smoothing, moving averages, regression analysis, and trend projection. Since any error in the assumptions will result in a similar or magnified error in forecasting, the technique of sensitivity analysis is used which assigns a range of values to the uncertain factors (variables).

Trend Analysis Definition

Method of time series data (information in sequence over time) analysis involving comparison of the same item (such as monthly sales revenue figures) over a significantly long period to (1) detect general patter of a relationship between associated factors or variables, and (2) project the future direction of this pattern.

As a conclusion, by referring to my previous post about https://people.utm.my/suraya/2017/09/14/predictive-analytics-vs-business-intelligence/ , then analysis is more on BI and analytics and forecasting is more on Predictive Analytics.


Utilizing Tableau Free Software for students

If you’re a student looking to land an internship or your first full-time job, you probably know that companies are looking for people with data skills. But they’re not just looking for any data talent—they’re specifically looking for people who know how to use Tableau. In fact, Tableau was recently listed as the third fastest growing technical skill in demand.

You’ve taken the first step in joining the community of over 100,000 students who are using Tableau each year! Now that you have your free license, you can begin learning these valuable skills that will help you land a job. Here are three steps to help you navigate the beginning of your Tableau journey:

1. Learn Tableau

The first step to being successful with Tableau is learning the tool itself. Recent grad Matt Atherton states, “Start with tutorial videos – first the Getting Started video on Tableau’s website. When you’re watching these, think about how to visualize your own data”. This short 25-minute video will provide you with an overview of Tableau Desktop from start—connecting to data—to finish—sharing your completed visualizations.

Once you’ve gotten the lay of the land, you can dive deeper into specific functionality with the Starter Kits and on-demand training videos on our website. As a student, Lynda.com is also a great resource, since many schools have subscriptions that allow for free access. Search for Tableau and you’ll find hundreds of videos and courses, many created by experts in the Tableau community.

Speaking of our community…

Our community is part of what makes Tableau so unique. Not only is our community active on our user forums, they also create a bunch of great training content. Check out the Tableau Reference Guide created by one of our Zen Masters, Jeffrey Shaffer.

2. Get inspired and start practicing

Once you start learning the functionality of Tableau, the next step is finding data you want to analyze. We’ve compiled a list of free data resources to help.

Another great way to find data is to check out the viz gallery on Tableau Public. Once you find an interesting viz, many authors allow you to download the workbook (simply click on the download icon in the bottom right-hand corner of the viz). From there, you can reverse engineer the viz to see how the author created it. Or, you can use the data to create your own viz. Here are a few of my favorite vizzes:

That’s not all. Makeover Monday, currently run by Tableau Social Ambassador Eva Murray and Tableau Zen Master Andy Kriebel, is a great way to start honing your data viz skills and get involved in a broader conversation about and with data. Each week a link to a chart and its data is posted online. Your task is to rework the chart and then share it on Twitter. This is a great way to engage with the Tableau community and get feedback on your work. And if that’s not enough, take your Tableau skills to the next level with Workout Wednesday.

3. Share your work

Once you’ve started created your own vizzes, don’t forget to publish them to your Tableau Public profile to start your data portfolio (learn how to do that here). A great example of this is Corey Jones’s profile. He started his data portfolio while he was a student at Saint Joseph’s University. Once you’ve published a few vizzes, you can add your Public profile link to your resume and LinkedIn profile to showcase your skills to future employers and get a leg up on the competition.

I wish you the best of luck on the start of your Tableau journey and can’t wait to see what you create. Don’t forget to enter your viz into our student contest for a chance to win Tableau swag. If you don’t yet have a free student license, request yours today!

learn more from here: https://public.tableau.com/en-us/s/blog/2017/09/3-steps-make-most-your-free-student-license

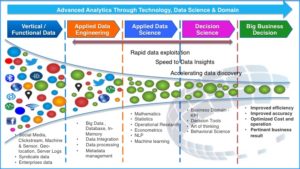
Predictive Analytics vs Business Intelligence

According to tibco (2017), flat dashboards (err… most probably, they are referring to BI) are killing analytics. When it comes to data visualization technologies, most vendors offer similar insights, along with graphing and storytelling functionality. What you most often see are screens with two or three panels that have a nice looking graph or two. If you click on the graph or adjust the controls, the visualization may change. It’s not bad. You can explore simple data sets, usually those stored in a spreadsheet table. You get fast results. You might even apply a statistical function or two. These dashboards are fundamentally fat. If you had magic virtual reality glasses and could pull the dashboard of the screen and look at the way it was made, you might see an inch or two of data and analytics behind each panel. If you want to change the data used or adjust the analytic, you go back to the spreadsheet or to the statistics package that calculated the analytic.

Flat dashboards provide a limited amount of insight. Usually, when fat dashboard technology is used in a company, it becomes a form of reporting, offering static information. The result is a proliferation of low-value visualizations that analyze small sets of data for individuals or groups. In a typical company, there could be hundreds or thousands of these low-value reports, which leads to a management and maintenance nightmare. Furthermore, because reports are uncoordinated, ad-hoc, and based on tiny slices of whatever-data-is-on-hand, they often lack a level of correctness and completeness, which canlead to incorrect conclusions and business mayhem. The old adage “garbage in, garbage out” too often applies to fat dashboards.

http://www.olspsanalytics.com/predictive-analytics-vs-business-intelligence/