Data Monitoring from assurance perspectives.

  1. Data monitoring activities
    1. What is data monitoring?
      1. Define monitoring
        Monitoring is the verb of a monitor. Google defines it as observe and check the progress or quality of (something) over a period of time; keep under systematic review. It is also a listen and report on activities that are important to maintain regular surveillance over.

        Synonyms to observe, watch, track, keep an eye, keep under observation, keep watch on, surveil, record, note, oversee.
         

        From the business dictionary, it is the supervising activities in progress to ensure they are on-course and on-schedule in meeting the objectives and performance targets.

        From dictionary.com, monitoring is something related to the control system that serves to remind or give warning. It is important to arrange for observing, detecting, or recording so that the activities/operation is under control.
         
         
      2. Define data monitoring
        Interesting facts from https://goo.gl/qSv9Aa, they define Monitoring as the systematic process of collecting, analyzing and using the information to track the progress of any program toward reaching its objectives and to guide management decisions. It is aligned with my thinking (please refer to my earlier post about monitoring + data temporal) when this article mentioned the relationship between monitoring activity and process (related to performance, formative evaluation?) Thus, the program indicator is relative to the progress of time (start, durations, and end).

        One more thing, they always relate the activity of monitoring with the evaluation. This is because, in evaluation – it is a must to provide evidence-based information that is credible, reliable and useful. Thus, through monitoring, we can provide these kinds of evidence that can lead to future findings, recommendations, and the lessons to inform future decision making.Evaluation has been defined as a systematic assessment of any activities’ performance. It focuses on expected and achieved accomplishments, examining the results chain for the whole process, its contextual factors, and causality (wow!, it means everything – from input, activities, outputs, outcomes, and impacts). They also highlight the determining of the relevance, impact, effectiveness, efficiency and sustainability interventions as the result of the evaluation (for the time being, I don’t think I can cover it all since it is too wide).

      3. Define data monitoring activities.
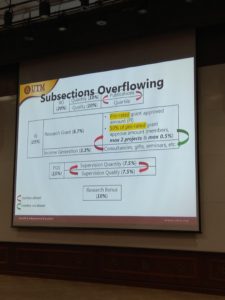
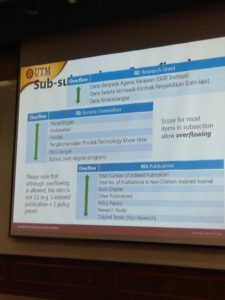
        1. Examples of monitoring activities
  2. Assurance perspectives
    1. What is assurance?
    2. What the users want to be assured when they are doing the monitoring activities?
    3. Thus, from no 2 understanding – it is what we must cater when we are providing/presenting data for monitoring activities.
  3. In this case, let’s try focus and compare the assurance perspective from these five scenarios;
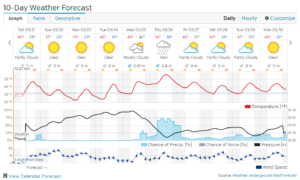
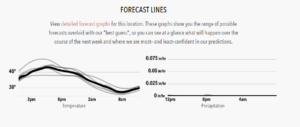
    1. Weather forecast
    2. Telco-data
    3. Trend analysis
    4. Project management monitoring (construction)
    5. Data Myra monitoring

References:

  • Read more: http://www.businessdictionary.com/definition/monitoring.html
  • Dictionary.comQuite interesting – I will read more about monitoring and evaluating on these:
  • http://www.endvawnow.org/en/articles/331-why-is-monitoring-and-evaluation-important.html?next=332
  • Frankel, Nina and Anastasia Gage. 2007. “M&E Fundamentals: A Self Guided Minicourse.” U.S. Agency for International Development, MEASURE Evaluation, Interagency Gender Working Group, Washington DC.
  • Gage, Anastasia and Melissa Dunn. 2009. “Monitoring and Evaluating Gender-Based Violence Prevention and Mitigation Programs.” U.S. Agency for International Development, MEASURE Evaluation, Interagency Gender Working Group, Washington DC.

The real story of Nabi Daud and the lesson learned from it (reflection from Surah as Sad)

Do you remember the story of two people that one is having 1 sheep and the other is having 99 sheep?

When they tasawwaru (root word is surah) – castle (long wall to protect secure place) to penetrate. These two people ambushed Nabi Daud through tasawwaru and he was panic and being reminded not act on impulse.

Two siblings in which one own 1 sheep and the other owned 99 sheep (Israeliyat mentioned about 99 wives instead of sheep) – Daud jumped to the conclusion without hearing the other party. Two parties have an argument – Be fair in your judgment. Hear both sides out before passing any judgment. Don’t follow impulsive desire.

Thus, when two parties have an argument – be fair in your judgment. Hear both sides out before passing any judgment. Don’t follow impulsive desire.

When you are a judge – you must hear from both sides.

Hear more and in details from Nouman Ali Khan here – https://www.youtube.com/watch?v=XeuvMS25bok


eLPPT – initiatives in 2017

The staff might get marks on these:

1. Mark indicator for each component input

2.To consider space load in elppt

3. Staff own initiative – e.g. use their own money to get grant, consultation and  -consider for them to claim back.

4. Way forward is going to ‘differentiated career pathway (DCP) in 2018


eLPPT Roadshow

Above picture – cannot be overflow. Must cover each category.

Belowpicture – Among these group – eLPPT can be overflow (like concept fardu kifayah)

Temporal Data and Weather Forecast

Weather data is temporal data. It changes according to time (hours, day, month or years). Since weather is crucial for us human to do our activities, people forecast it. By having forecast data, it helps business and people plan for their outdoor activities. In Malaysia – it is very crucial during kenduri kahwin, some people still believe and hire ‘bomoh hujan’ to forecast and prevent rain during the wedding day. More over, it helps business plan like transportation, construction and farmers for crop irrigation and protection. Eventhough the weather data in Malaysia is not as crucial as in four season country (since it will not help people on how to dress or either to bring extra coat for windy days) but forecast data can help in term of health issue like asthma and heat stress especially for children’sschool activities.

Since the data for Forecast weather is everywhere – from your own handphone, PC, TV and radio. I think for Haida (since you are from MANA – assurance course), it is time for us to check the accuracy between the forecast data and the real one. It will help to prove the accuracy of Jabatan Meteorologi Data. If the comparison has been done, why dont we visualize the comparison to ease the forecast data understanding.

Thus, the objectives for Haida research can be something like this

  1. Compare between forecast and real set of weather data.
  2. Visualize the comparison
  3. Identify the accuracy of the forecast data – reliability/assurance of the data OR maybe we can access how people trust/ the data?  (hmm.. this can give awareness about the credibility of jabatan meteorologi data)

In order to do that, what you need to do this week is:

  1. Identify and get the forecast and real set of weather data (try to get a set for 10 days first)
    1. Type of data – the general one, things like this:

Source: weather underground weather forecast.

  1. Bring that set of data for our next discussion (17 August 2017).
  2. Have a peek on your expected outcomes, something like this (but not necessarily exact):

  1. Read and understand this http://stat4701.github.io/edav/2015/03/25/hafiz-weather-1/very good to get some ideas for your LR (please explain to me your understanding about this article in our discussion later)

How is telecom industry benefiting their data?

How is telecom industry benefiting the big data?

Telecom industries are sitting on a gold mine, as they have plenty of data. But what they require is a proper digging and analysis of both structured and unstructured data to become a valuable asset to the industries.

Big Data from the perspectives of telecommunication industry

Through proper digging, they are able to get deeper insights into customers’:

  • Behaviour – combat fraud
  • Service usage patterns – marketing interest, marketing agility  (related to temporal data)
  • Preferences
  • Real time interests – real time customer insights (related to temporal data)

From Acker et al (2013), the telecom industry must experiment their own data. Demonstrating what they have on hand to see what kinds of connections and correlations it reveals, This process must be carried out iteratively to emerge the more efficient operations and more effective marking.

Source: Acker et al (2013)

References:

  1. http://bigdata-madesimple.com/11-interesting-big-data-case-studies-in-telecom/
  2. Ackers (2013) Benefiting from big data. A new approach for the telecom industry. published by Booz & Company.

Temporal Data and Business Intelligence

Temporal Data and Business Intelligence

According to Aigner et al (2007), time is an outstanding dimension. In popular physics, time is the fourth dimension. For ages, scientists have been thinking about meaning and implications of time. Understanding temporal relations enables us to learn from the past to predict, plan, and build the future. In the world of computerization, time is like an invisible presence. Business systems mostly operate in some sort of existential present tense and programmed into a unique timestamp, flags and update. Hence, it is no surprise that time is also a key concern in Visual Analytics, where the goal is to support the knowledge crystallization process with appropriate analytical and visual methods [1]. Visualizing time-oriented data, which is the focus of this paper, is not an easy business. Even though many approaches to this task have been published in recent years, most of them are specific to only a particular analysis problem. The reason why most methods are highly customized is simple: it is enormously difficult to consider all aspects involved when visualizing time-oriented data.

In current years, the temporal data is still valid and significant to emphasize the value of Business Intelligence (BI). The temporal concept enables business users to explore past business events to understand problems, see trends (monitor and review the data) and these activities can support the decision making as well. Thus, in many cases, users get point-in-time views of the business at defined times, such as the daily or month-end close. However, as business operations have become increasingly real-time in nature, the need for a continuous history that provides an ongoing, complete and accurate record of transactions and business performance has become paramount. Temporal — and in particular, bi-temporal — data is thus central to effective BI processes and should be a core part of any data warehouse or data mart (Devlin, BI Expert Panel)

Furthermore, the business context is growing in the complexity of both BI needs and the temporal characteristics of data. Decision making is increasingly real-time in nature. Predictive analytics extends our interest from the past and present into the future. Big data and the Internet of Things take us into a new world where the people who use data often don’t control its structure or content. Even the bi-temporal model, Johnston is reluctantly forced to admit, may turn out to be insufficient to carry all the temporal meaning that a user may wish to impart to or extract from business data. A tri-temporal model, with three-time axes, may eventually be required to make full sense of data. Then quoted from Johnson, the understanding for the interconnection between Bi, analytics and data temporal is vital if we are to navigate the expanding world of big data. Without such an understanding – Devlin believes the implementation of BI was destined to crash and burn. Therefore, it should be seen as mandatory preparation to revisit the theory and practice of temporal data.

An important issue that concerns all previous points is task-orientation. This means that Visual Analytics systems should automatically suggest and parameterize visual, analytical, and interaction methods based on the users’ task at hand. Recently, an interesting analysis of possible visualization tasks has been published in [3]. That list of tasks can be used as a basis for future research on task-oriented Visual Analytics. In that regard, perceptual issues must be further investigated. Empirical tests have to be conducted to judge which forms of presentation (2D or 3D, static or dynamic, etc.) are best suited for particular analysis tasks.

Aigner, W., Miksch, S., Müller, W., Schumann, H. and Tominski, C., 2007. Visualizing time-oriented data—a systematic view. Computers & Graphics31(3), pp.401-409.

Devlin, B. Temporal Data Reality: In BI, time is of the essence. https://goo.gl/VdEt7T

Representations of Data Monitoring – e.g Telecommunication data

Definition of telecommunication: 
Communication over a distance by cable, telegraph, telephone or broadcasting. It is the transmission of signs, signals, messages, words, writings, images and sounds or intelligence of any nature by wire, radio, optical or other electromagnatic systems. Telecommunication occurs when the exchange of information between communication participants includes the use of technology. It is transmitted either electrically over physical media such as cable or electromagnatic radiation such as technology.

The value of data within telecommunication:
The most valuable telco data is an untapped source of customer information. Thus, the big companies nowadays turn telecom carriers since it has a valuable source of customer data (2017 study shows over than 300 brands in the US, UK and France finds than 67% of brands consider telecoms operators to be a better original source of data insights than Google, facebook, Apple and Samsung). Eventhough Google has 59% and Facebook has 52% remain the dominant brand partners for data insights and digital advertising, 26% of brands say they do currently partner with telcos that specialize in digital advertising. However, 48% of brands are not aware of telecoms operators’ ability to even offer these insights – and this is a good news for telco and it is our role to let them aware.

The potential that can be done with telco data:

  • Better original source of data insight
  • Underpin digital advertising – with high quality and compelling.

Special attention to Khairunnisa – please look at factor 2)better data analytics and 7)data was updated more regularly. The combination of these might bring us focus to on data temporal. See you on friday 11 August ’11 (Airis’ birthday)

Thanks to Ian Barker at https://goo.gl/fjQg3w and Ovum Survey https://goo.gl/vJbdnZ