
Category: Project

Development of A Web Map-Based Muslim Cemetery Application in Kangkar Pulai
Alhamdulillah… Praise be to God, and with His blessings, I am delighted to share the successful completion of another undergraduate dissertation under my supervision. Muhammad Syafiq bin Mat Tah... Read More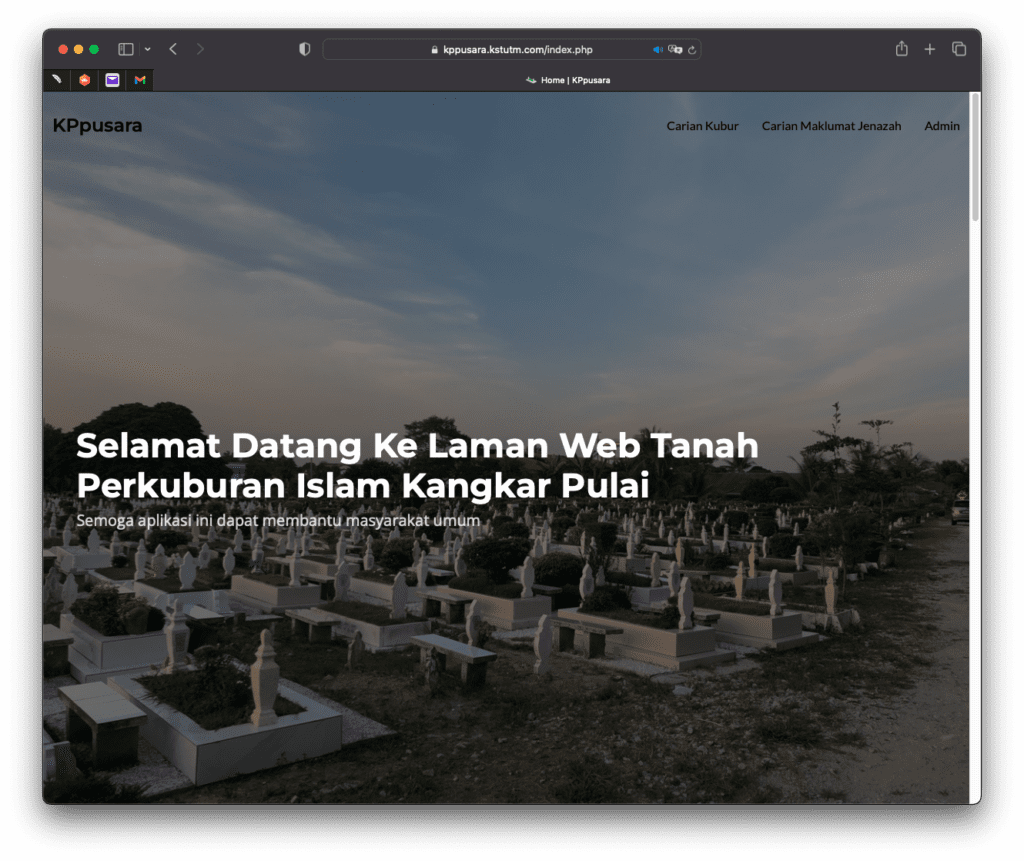
KPpusara Website: Laman Web Tanah Perkuburan Melayu Kangkar Pulai
By Shahabuddin Amerudin URL: https://kppusara.kstutm.com Presenting the remarkable and forward-thinking project developed by Muhammad Syafiq bin Mat Tahir, a final year student pursuing a Bachelor of ... Read More
Understanding Location Accuracy Requirements in Various Applications
By Shahabuddin Amerudin Introduction Location accuracy plays a vital role in numerous applications, enabling precise positioning, navigation, and tailored experiences. Different applications have vary... Read More
Understanding Location Accuracy in Consumer Smartphones
By Shahabuddin Amerudin Introduction Consumer smartphones have become integral to our daily lives, offering a wide range of features and functionalities, including location-based services. The accurac... Read More
Understanding Location Inaccuracy in Mapping Applications
By Shahabuddin Amerudin Introduction Location accuracy plays a crucial role in mapping applications, allowing users to navigate, find points of interest, and track their movements. However, it’s... Read More
Published Article in UTM NewsHub
Link: https://news.utm.my/2023/06/utm-and-kg-sg-timun-empower-mangrove-conservation-through-an-innovative-csr-programme/... Read More
UTM and Kg. Sg. Timun Empower Mangrove Conservation through an Innovative CSR Programme
By Shahabuddin Amerudin Linggi, Negeri Sembilan, June 3, 2023 – In a remarkable collaboration, Universiti Teknologi Malaysia (UTM) and the Kg. Sg. Timun community, have once again united to cond... Read More
Unveiling the Secrets of Mangrove Ecosystems: The Importance of Mapping Mangrove Trees and Their Habitat
By Shahabuddin Amerudin Mangrove forests are remarkable ecosystems that thrive along coastlines, bridging the gap between land and sea. These biodiverse habitats provide critical ecological services, ... Read More
Mangrove Forests: Sustaining Life and Protecting Coastal Ecosystems
By Shahabuddin Amerudin Introduction Mangrove forests are incredibly vital ecosystems that thrive in the interface between land and sea. These unique habitats, characterized by a complex network of in... Read More
The Life Cycle and Interactions in a Mangrove Forest Ecosystem
By Shahabuddin Amerudin Mangrove forests are unique and diverse ecosystems that support a wide range of plant and animal species. Within these forests, a complex web of life cycles and interactions ta... Read More
The Role of Humans in Preserving and Rehabilitating Mangrove Forests
By Shahabuddin Amerudin Mangrove forests are crucial ecosystems for both marine and terrestrial life. Humans play a significant role in preserving and rehabilitating these mangrove forests. As individ... Read More
Leveraging GIS Software for Efficient Infrastructure Management in Rapidly Urbanizing Cities
By Shahabuddin Amerudin Introduction Rapid urbanization presents significant challenges for cities worldwide, requiring effective infrastructure management and urban planning strategies. The evolution... Read More
Optimizing GIS Workflows: Examples of Computer Configurations for Different Scenarios
Suggestion for Citation: Amerudin, S. (2023). Optimizing GIS Workflows: Examples of Computer Configurations for Different Scenarios. [Online] Available at: https://people.utm.my/shahabuddin/?p=6305 (A... Read More
The Impact of Time Zone Differences on Sleep Patterns and Human Life: A Case Study of Malaysia
Suggestion for Citation: Amerudin, S. (2023). The Impact of Time Zone Differences on Sleep Patterns and Human Life: A Case Study of Malaysia. [Online] Available at: https://people.utm.my/shahabuddin/?... Read More
