
Category: Teaching

Rang Undang-Undang Juruukur Tanah Berlesen (Pindaan) 2024: Ringkasan dan Analisis
Ringkasan RUU Juruukur Tanah Berlesen (Pindaan) 2024 Pindaan Akta ini mencerminkan usaha kerajaan untuk memastikan bidang ukur geomatik di Malaysia berkembang selari dengan perubahan teknologi dan men... Read More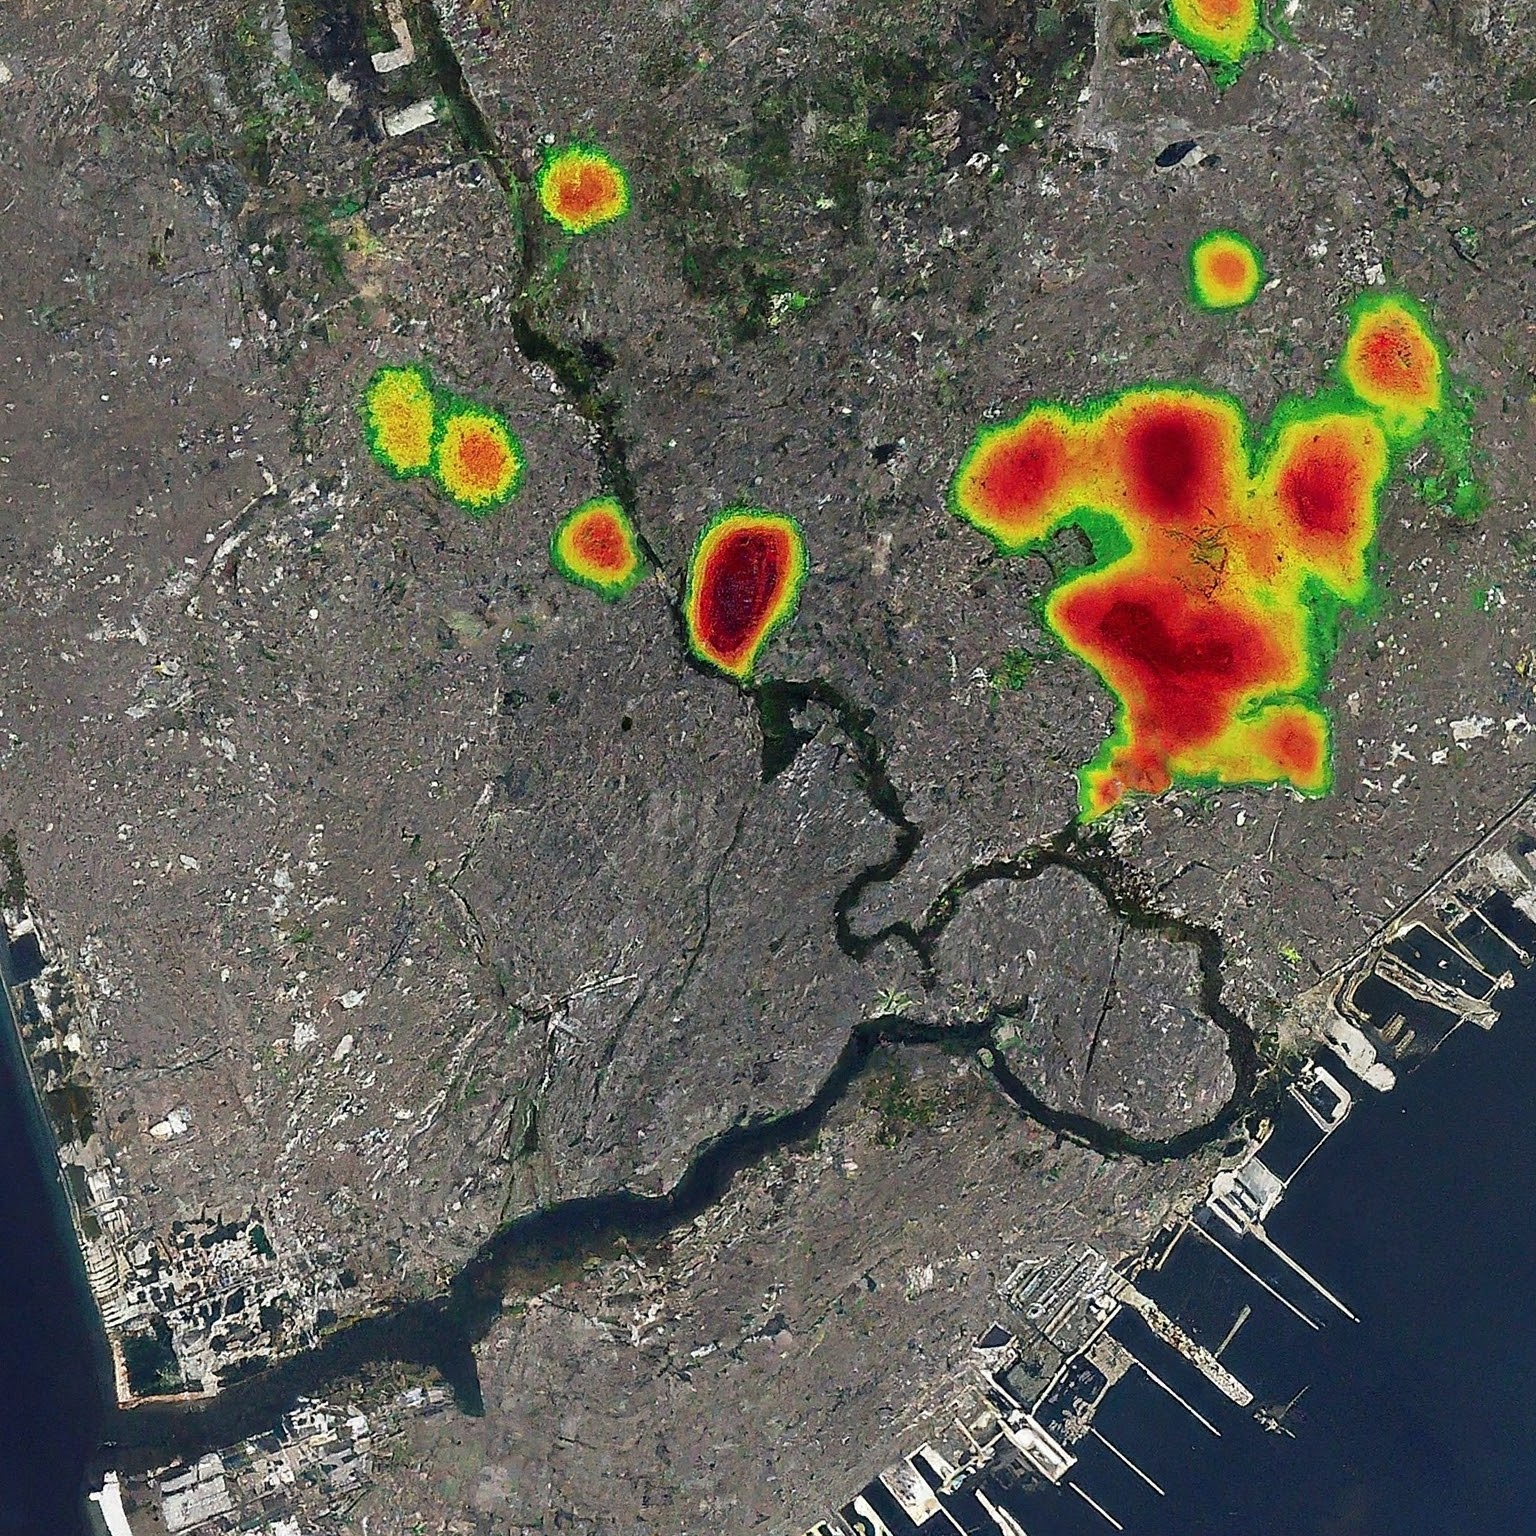
Advancing Urban Planning with GeoAI through Global Street Network Analysis
By Shahabuddin Amerudin Introduction Geographic Artificial Intelligence (GeoAI) integrates Geographic Information Systems (GIS) with artificial intelligence (AI), offering advanced capabilities for ur... Read More
Leveraging GIS for Enhanced Urban Planning Insights from Global Street Networks
By Shahabuddin Amerudin Introduction Geographic Information Systems (GIS) have become indispensable tools in urban planning, offering the capability to analyze spatial data and derive actionable insig... Read More
The Influence of Street Network Configurations on Urban Planning and Population Dynamics
By Shahabuddin Amerudin Introduction Urban planning is a multifaceted discipline that orchestrates the development and organization of cities to optimize functionality, sustainability, and livability.... Read More
Integrating GIS with Data Science
Introduction Data science is an interdisciplinary field focused on extracting meaningful insights and knowledge from data using a combination of scientific methods, algorithms, and systems. This field... Read More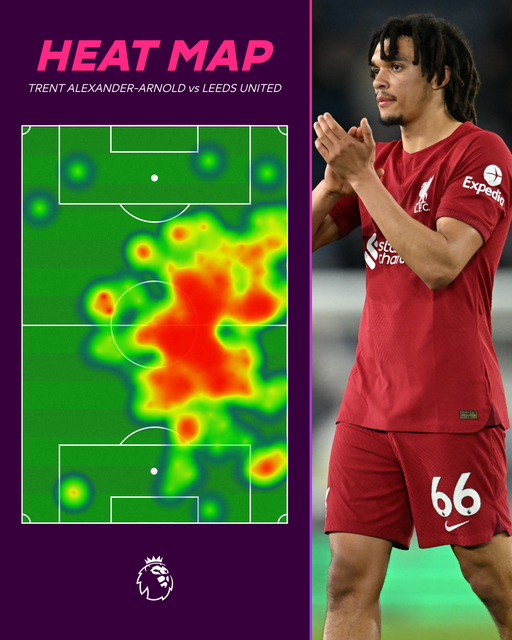
Analyzing the Heatmap of Trent Alexander-Arnold vs. Leeds United
By Shahabuddin Amerudin The heatmap serves as a visual representation of the areas on the football pitch where Trent Alexander-Arnold was most active during the match against Leeds United. The intensi... Read More
Boids Algorithm for Simulating Crowd Movement in Urban Planning and Disaster Management
By Shahabuddin Amerudin Abstract The ability to accurately simulate crowd movement during emergencies is critical in urban planning and disaster management, as it helps design effective evacuation str... Read More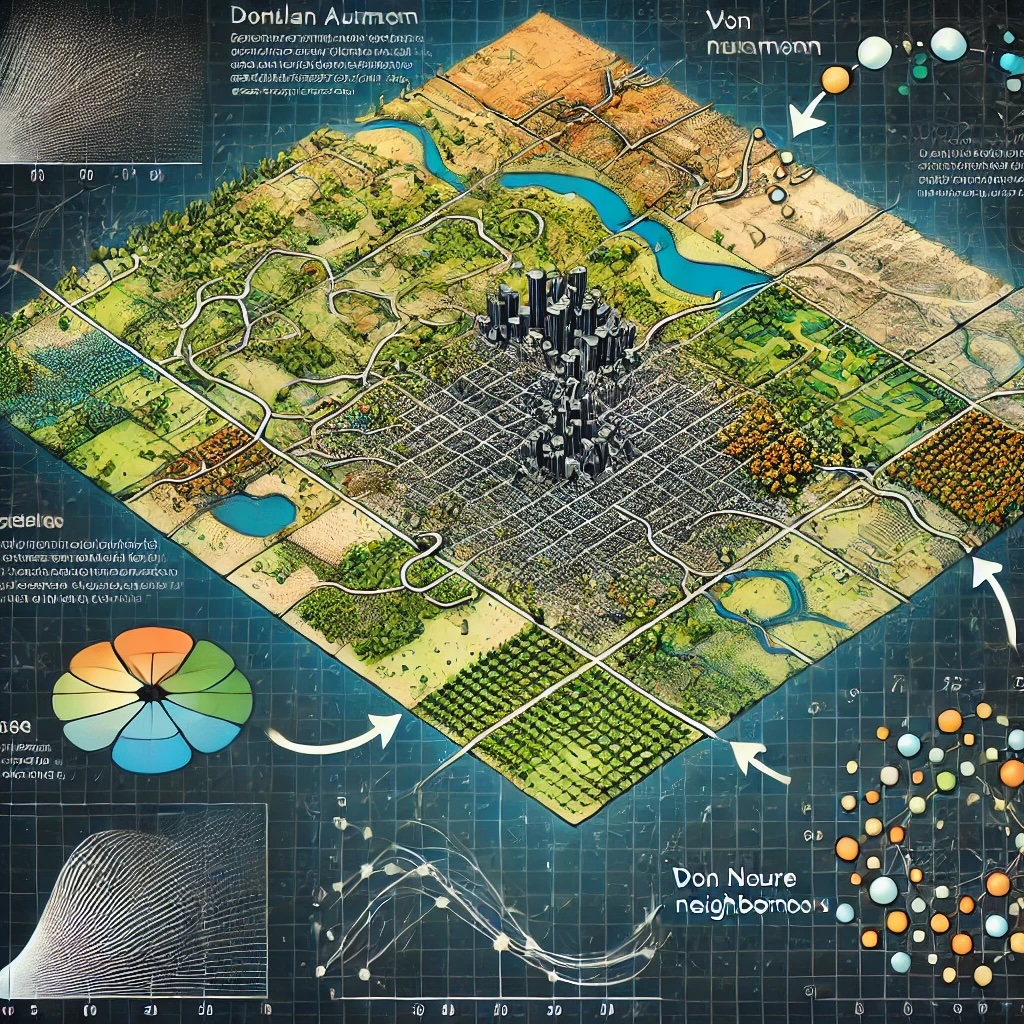
Penggunaan Automata Selular dalam Sistem Maklumat Geografi (GIS)
Oleh Shahabuddin Amerudin Automata selular adalah model matematik yang digunakan untuk memodelkan sistem yang terdiri daripada entiti individu yang berinteraksi mengikut peraturan mudah tetapi menghas... Read More
Pengkategorian Tahap Cabaran Projek Sarjana Muda dalam Bidang GIS
Oleh Shahabuddin Amerudin Dalam bidang Geographic Information Systems (GIS), Projek Sarjana Muda (PSM) boleh dikategorikan mengikut tahap cabaran, iaitu rendah, sederhana, dan tinggi. Memahami perbeza... Read More
Projek Sarjana Muda dalam Bidang GIS: Pilihan dan Tahap Kesukaran
Oleh Shahabuddin Amerudin Dalam bidang Geographic Information Systems (GIS), Projek Sarjana Muda (PSM) boleh dikategorikan mengikut tahap kesukaran, dari yang tinggi hingga sederhana. Memahami perbeza... Read More
Key Traits for Success in GIS Final Year Projects
By Shahabuddin Amerudin A Final Year Project, especially in the field of Geographic Information Systems (GIS), is a crucial milestone that demands a blend of technical expertise, critical thinking, an... Read More
Ciri-Ciri Pelajar Cemerlang dalam Projek Sarjana Muda
Oleh Shahabuddin Amerudin Projek Sarjana Muda (PSM) merupakan langkah terakhir dan paling kritikal dalam perjalanan akademik seorang pelajar di peringkat ijazah sarjana muda di universiti. Ia adalah s... Read More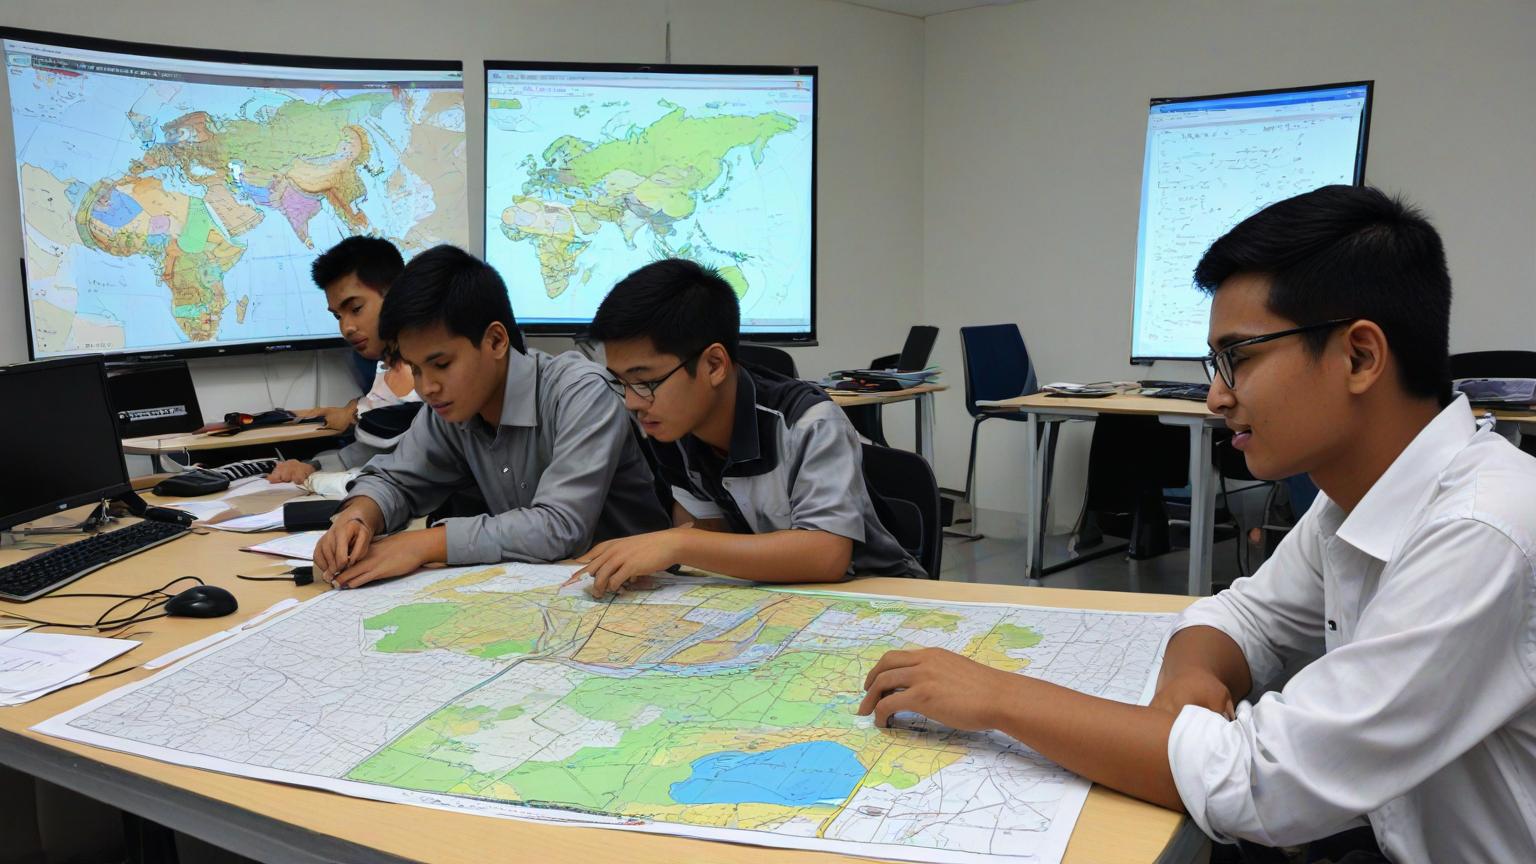
Kunci Kejayaan dalam Projek Sarjana Muda: Sifat dan Sokongan yang Diperlukan
Oleh Shahabuddin Amerudin Projek Sarjana Muda (PSM) adalah satu batu loncatan penting dalam perjalanan akademik seorang pelajar di universiti. Ia bukan sekadar satu tugasan akhir, tetapi merupakan man... Read More
Development of a Web-Based Application for Matching Students with Supervisors Using a Weighted Scoring Algorithm
By Shahabuddin Amerudin Abstract This paper presents the development of a web-based application designed to automate the matching process between students and supervisors. The application leverages a ... Read More
Developing an Automated Student-Supervisor Matching System for Academic Institutions: A Case Study
By Shahabuddin Amerudin Abstract The allocation of supervisors to students for research guidance is a critical process in academic institutions, particularly at the undergraduate level. This paper pre... Read More
Spatial Computing: The Next AI-Driven Business Revolution
By Shahabuddin Amerudin Spatial computing is rapidly emerging as a revolutionary force in the business world, merging cutting-edge technologies like artificial intelligence (AI), extended reality (XR)... Read More
The Role of Geospatial Technology in Health Communication and Disease Ecology
By Shahabuddin Amerudin Introduction In contemporary society, the integration of geospatial technology into public health practices offers unprecedented opportunities for improving health outcomes. Th... Read More
Spatial-Temporal Analysis Framework for Health and Disease Mapping and Modelling
By Shahabuddin Amerudin Abstract The study of spatial-temporal dynamics in health and disease mapping is crucial for understanding the spread and control of diseases. This review examines a comprehens... Read More