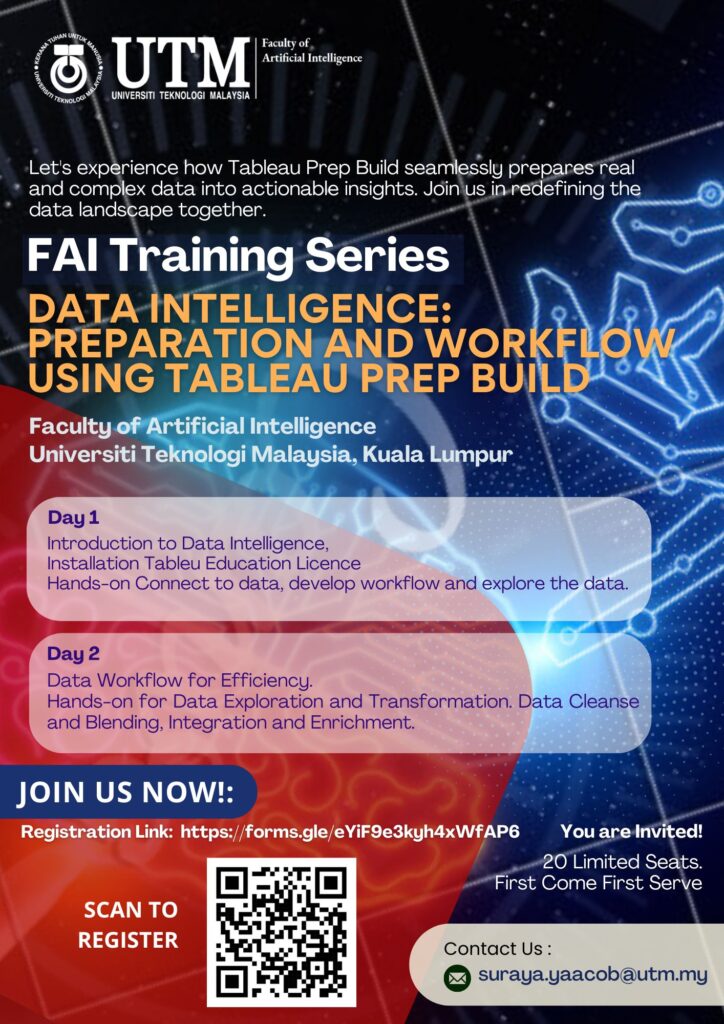
Advanced Informatics Department, Faculty Technology and Informatics Razak, Universiti Teknologi Malaysia Kuala Lumpur| Data Visualization and Analytics | Operational Business Intelligence Research Group
Today from 2.30 pm to 3.30 pm. I experienced the pitching session for Prototype Development Grant (PDF), Level 1 TRL 2-6. The pitching was a 10-minute presentation + 10-minute QnA.
A good experience with the panellists.
Among the Questions:
1. The competitors? – doHRM, Cascade (I don’t know the competitors.)
2. How to GTM (Go To Market)? – right now bundled with consultation.
3. What is the rationale for the RM15K price? – RM3k per year for five years.
4. 15K is too cheap? – They will feel like a low-quality product, and if it is too expensive, they won’t to buy it.
5. What is the value of your product? – not making the process of data collection easier. However, I will complement the tools they are using now and make monitoring and reporting more standardised and easier.
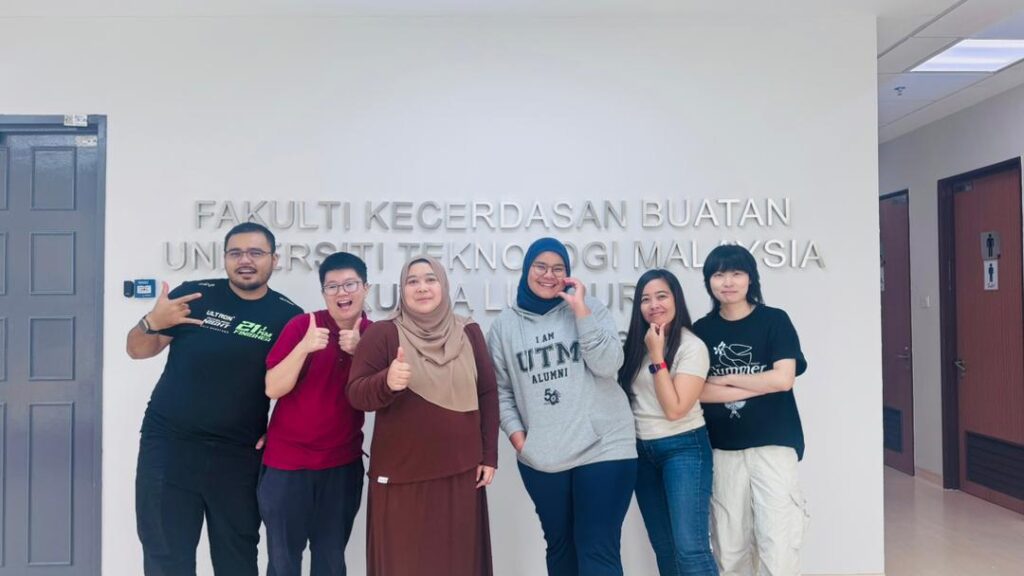
Together with the coordinator, Dr. Siti Amirah; Chairperson Dr Intan; Panel 1, Dr Shaliza (missing from the picture), Panel 2, me; and Panel 3, Dr Doris.
EUNICE NG HUI RONG PSO-OPTIMIZED RESAMPLING FRAMEWORK USING MACHINE LEARNING FOR CLASS-IMBALANCED E-COMMERCE FRAUD DETECTION
PRAHVINAH SHRI MUNIYANDI AUTOMATED CLASSIFICATION OF EMERGENCY DEPARTMENT DOCUMENT BY URGENCY USING MACHINE LEARNING APPROACH FOR MALAYSIAN HEALTHCARE
SELVENDROY A/L VEERATH THAMIL HARASAN SUPPLY CHAIN RESILIENCE OF PETRONAS IN MALAYSIA : ANALYSING THE IMPACT OF GEOPOLITICAL AND COVID-19 DISRUPTIONS USING DEA AND SIMULATION MODELS
SHAI LI JIUN PREDICTIVE ANALYTICS FOR RESIDENTIAL PROPERTY PRICE FORECASTING IN MALAYSIA USING MACHINE LEARNING
SHARMILA SANDRASAGRAN CLASSIFICATION OF EPC SUPPLIER FOR CONTRACT SELECTION USING MACHINE LEARNING METHOD
SITI AISYAH BINTI ADI MINIF A VISUAL ANALYTICS DASHBOARD FOR MENTAL HEALTH INDICATORS USING MULTI DATASET
HEBAHAN PROGRAM SEMPENA NATIONAL TRAINING WEEK (NTW) 2024 TERBUKA KEPADA ORANG AWAM
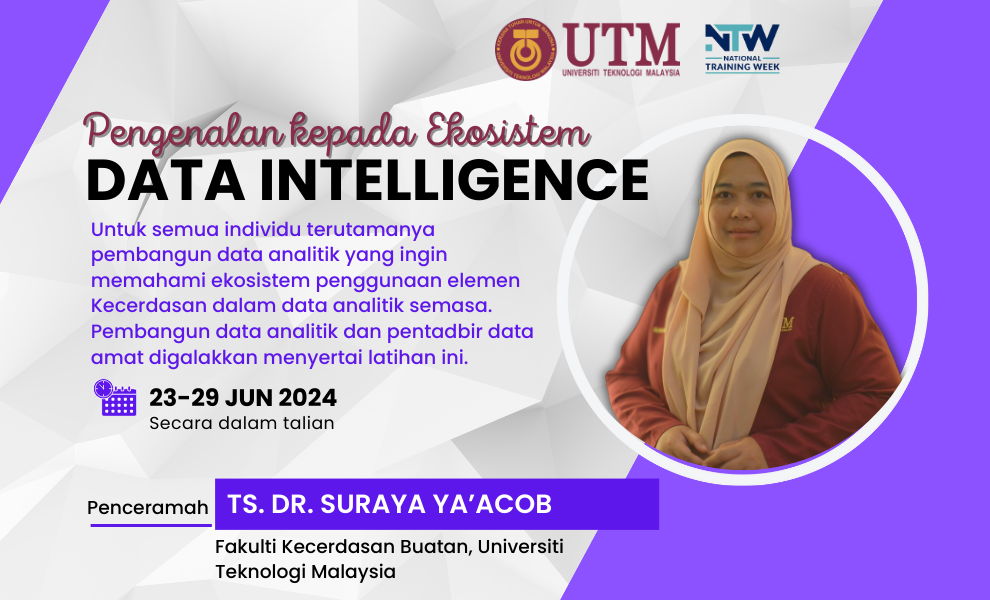
Tajuk Ceramah : Pengenalan kepada Ekosistem Data Intelligence Penceramah : Ts Dr Suraya Yaacob Tarikh : 25 Jun 2024 Masa : 11.00 pagi -12.00 tengah hari Kaedah : Secara dalam talian (Cisco Webex) Pautan : https://utm.webex.com/meet/suraya.yaacob
Mas Munirah is an independent student. I think sometimes she is too independent when she is solo traveling to Japan, Bali and frequent Temerloh-KL. Working at Pharmaniaga, one of the prominent pharmaceutical company in Malaysia, she is intends to do research on something that will contribute back to the company – hence, she picks this topic.
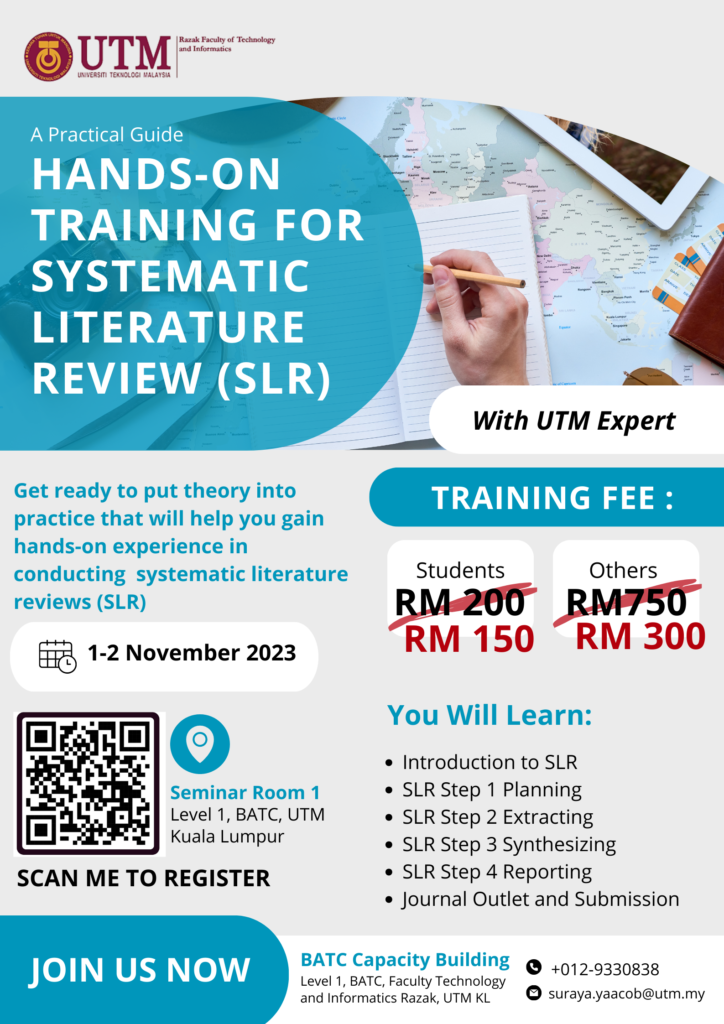
Capacity Building of Faculty Technology and Informatics Razak cordially invite all students and researchers to join A Practical Guide Hands-On Training For Systematic Literature Review (SLR). Participants will be coached by SLR Expert from UTM.
This coaching series will be held physically with the following details: Date : 1st – 2nd November 2023 Venue : Seminar Room 1, Level 1, BATC, UTM KL Promotion Fee : Students (RM150) Others (RM300)
Registration for this coaching session is open to all students and researchers, and places are limited to 25 participants only.
Register your interest here https://forms.gle/So7x618ZbJNYFgQWA FIRST-COME, FIRST-SERVED BASIS.
16-18 Disember 2022, berlangsung sesi pemindahan pengetahuan bagi Enterprise Architecture Skop 2 di Royale Chulan Pulau Mutiara. Buat kali pertamanya bengkel dianjurkan bila nama kementerian telah ditukar baru daripada KPLB kepada KKDW.
December 16-18, 2022, the knowledge transfer session for Enterprise Architecture Scope 2 at the Royale Chulan Pulau Mutiara. For the first time, the workshop is using a new name since the ministry has changed from KPLB to KKDW.
Perkongsian, penambahbaikan dan pembetulan supaya digitalization dapat memberi nilai business kepada KKDW melalui Enterprise Artchitecture adalah inti utama yang ditekankan dalam bengkel ini.
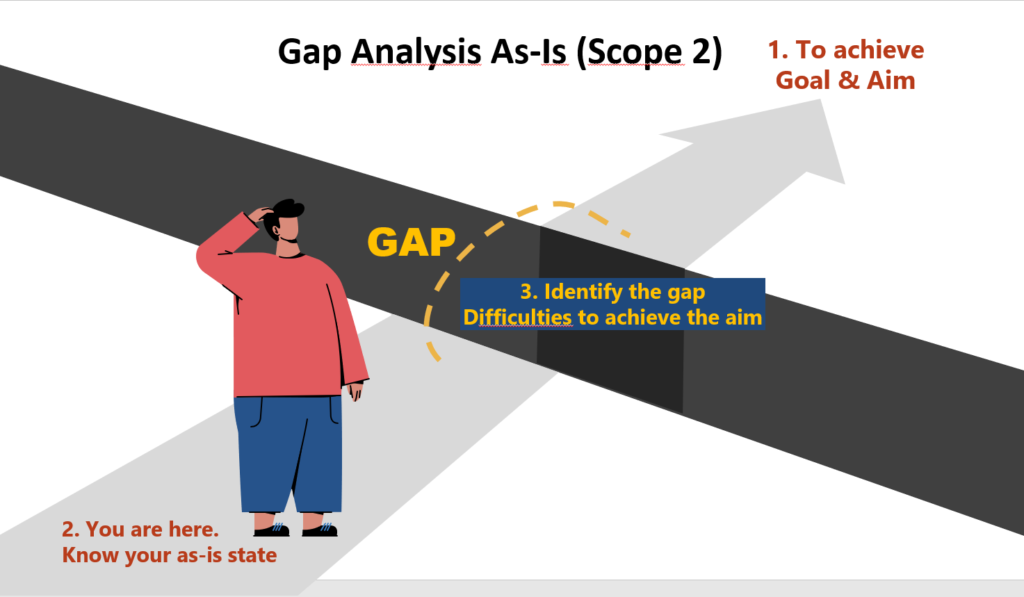
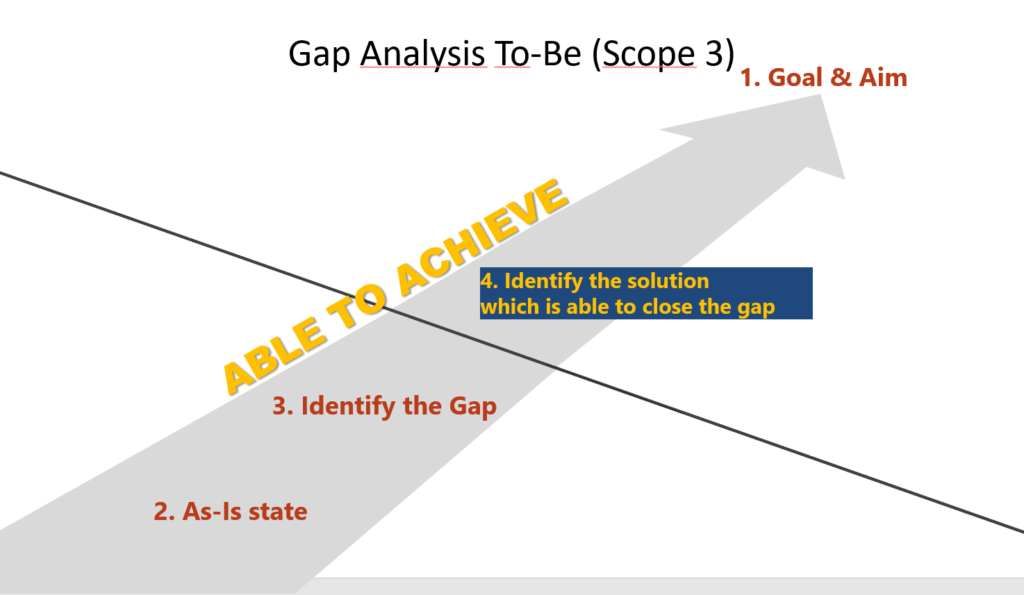
Menjurus kepada bengkel 2 As-Is – Analisis Jurang adalah jantung kepada penghasilan program dan inisiatif pendigitalan yang bernilai di KKDW. Memahami apa itu analisis jurang, proses yang terlibat di dalamnya dan kerangka kerja yang digunakan sebagai based-line agar proses analisis yang dibuat tidak tersasar daripada trend perkembangan pendigitalan semasa dan yang paling utama – dapat memberi manfaat kepada KKDW.
Sharing, enhancing and correcting so that digitalization can provide business value to KKDW through Enterprise Artchitecture (EA) is the main core that is emphasized in this workshop.
Gap Analysis is at the heart of generating valuable digitization programs and initiatives at KKDW. Understanding what is being defined as a gap analysis, the process involved and the framework used as a baseline so that the analysis process created does not stray from the current trend of digitization development and most importantly – can benefit KKDW.
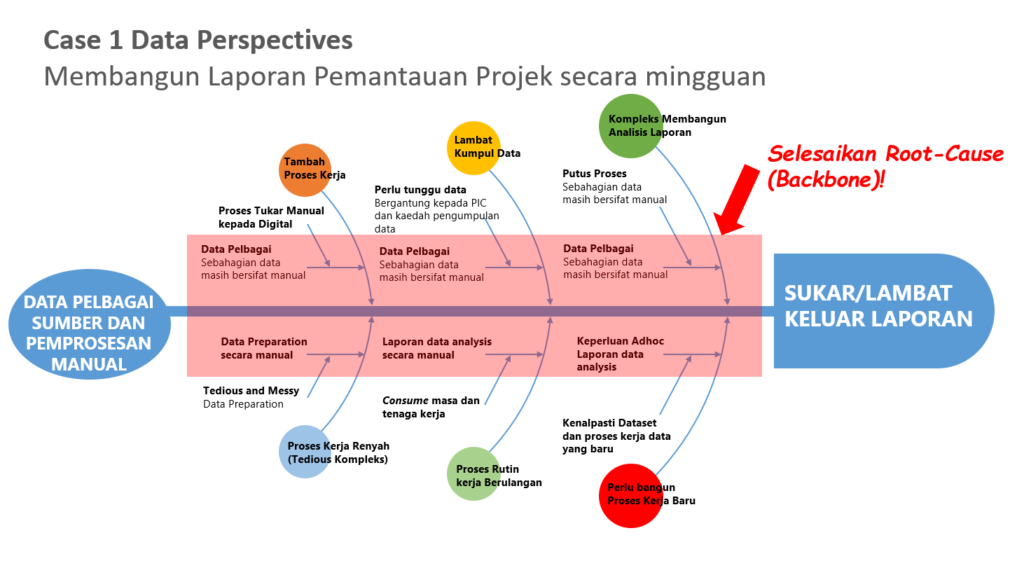
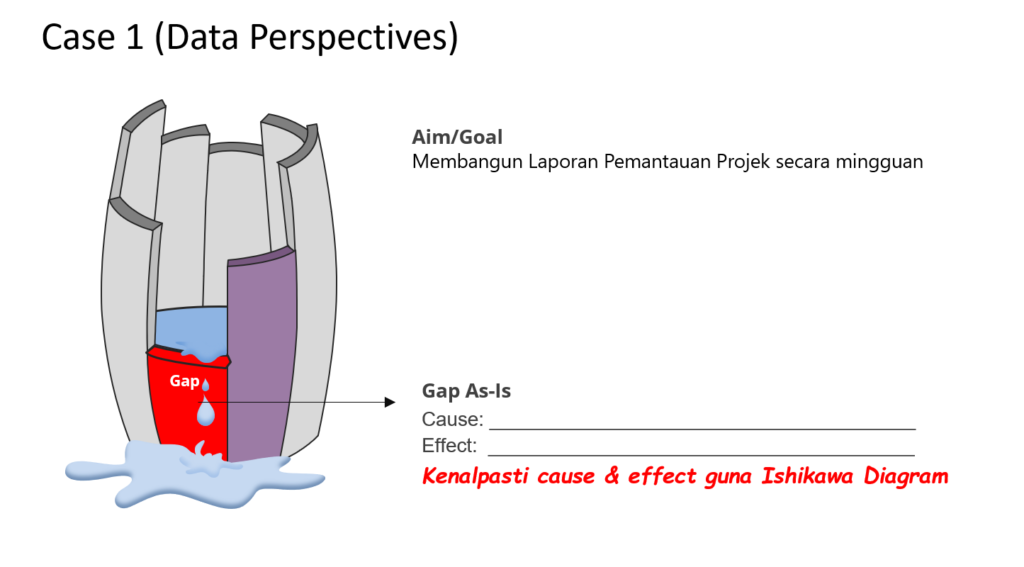
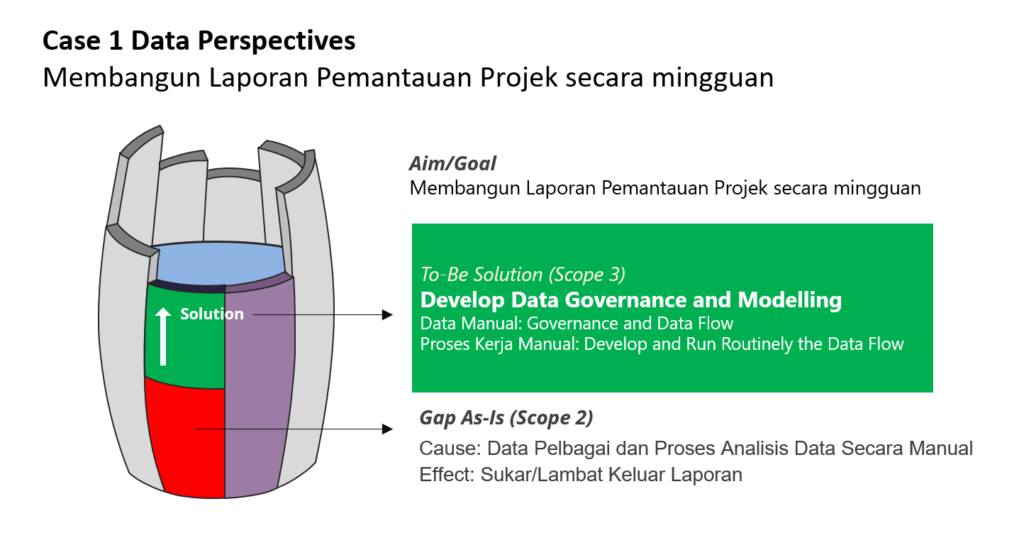
Dalam menyelesaikan masalah atau memberi solusi – perkara paling utama ialah mengenalpasti punca dan akibat. Selalunya mudah dilihat kesan iaitu daripada simptom yang ditunjukkan. Lanjutan itu perlu dicari puncanya (cause) dan punca yang menghampiri backbone adalah yang paling utama untuk diselesaikan. Kerana itu menggunakan Ishikawa Diagram adalan visual termudah untuk menggambarkan cause dan effect serta mana satu faktor yang perlu dipertimbangkan untuk diselesaikan.
In solving a problem or providing a solution – the most important task is to identify the cause and effect. Often it is easy to see the effect of the symptoms shown. Hence, it is necessary to find the cause and the cause that is nearer to the backbone is the most critical one to be solved. Therefore, using Ishikawa Diagram is the easiest way to illustrate cause and effect and then consider which factors need to be resolved.