
Tag: GIS
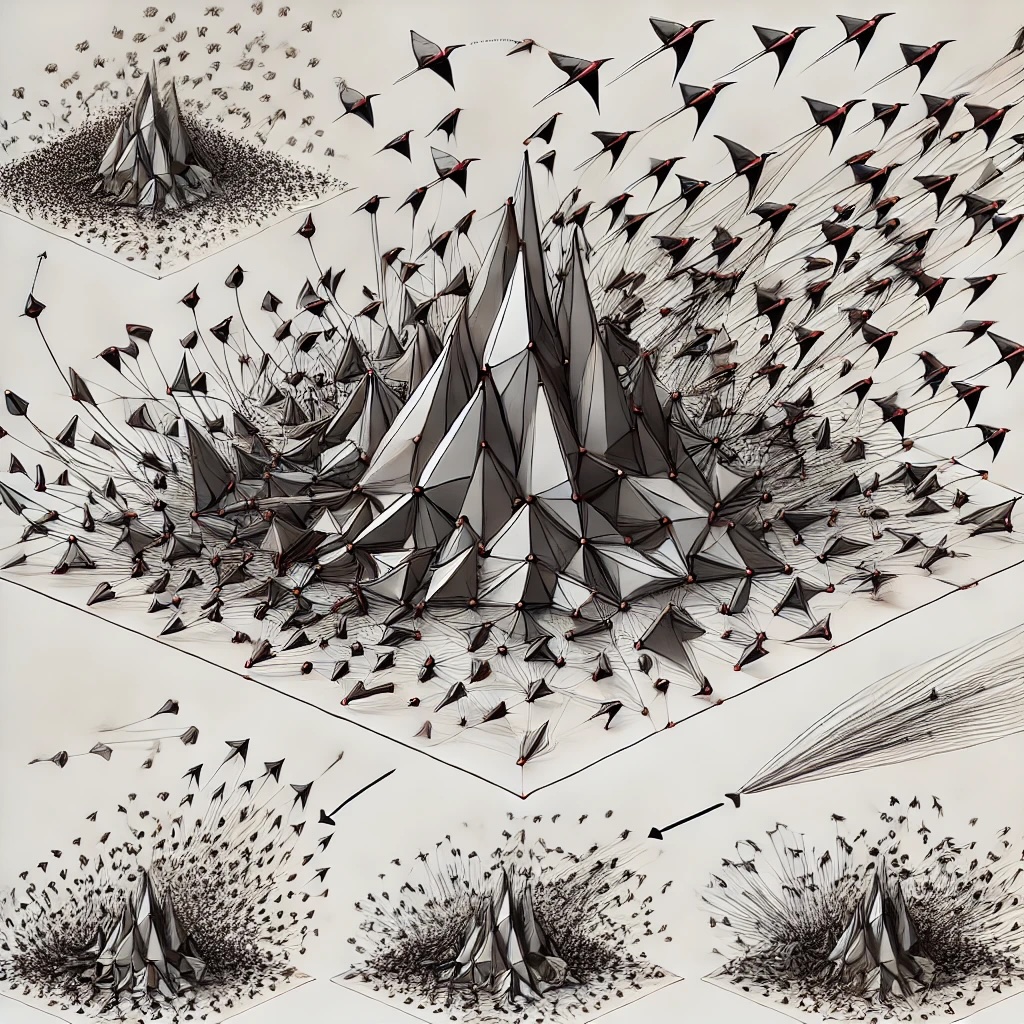
Algoritma Boids: Pemodelan Tingkah Laku Kolektif dalam Sistem Multi-Agen
Oleh Shahabuddin Amerudin 1. Pengenalan Algoritma Boids, yang diperkenalkan oleh Craig Reynolds pada tahun 1986, adalah model simulasi yang direka untuk meniru tingkah laku kawanan burung, ikan, atau ... Read More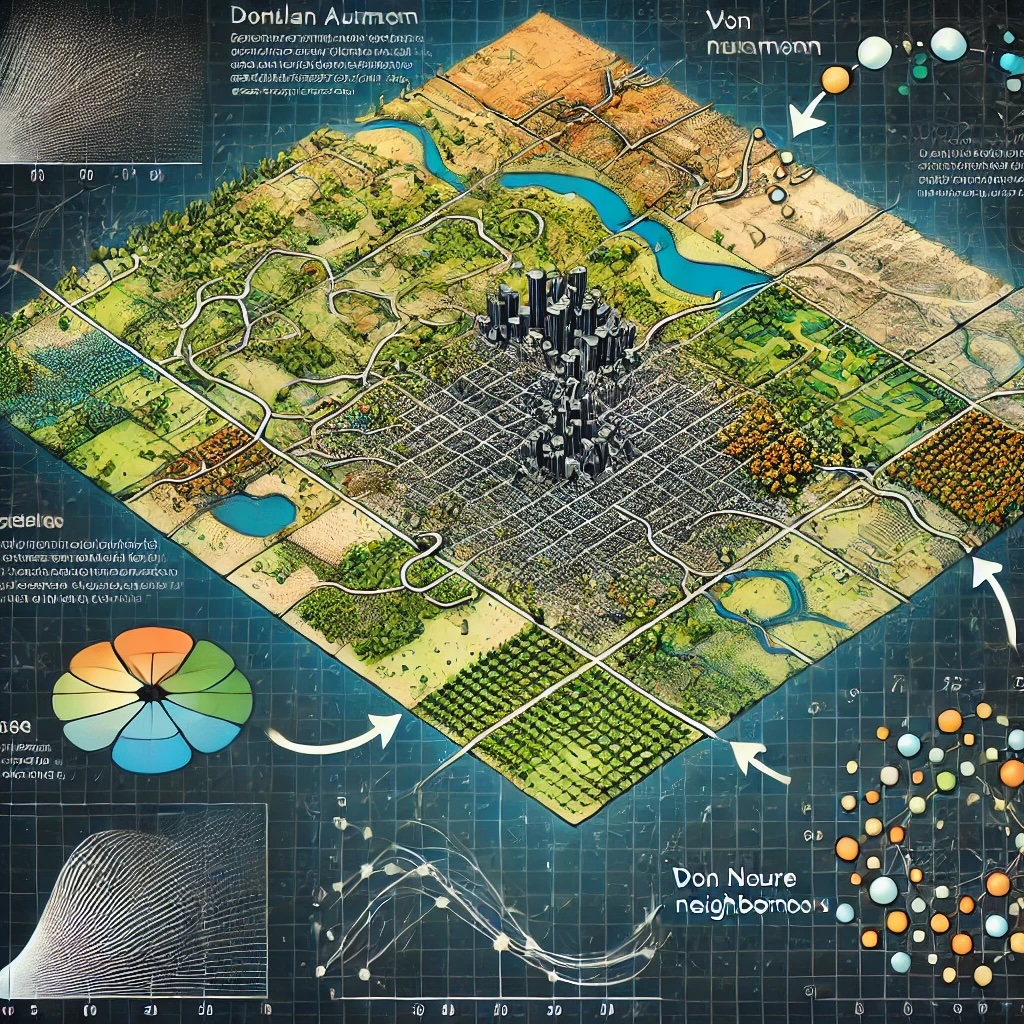
Penggunaan Automata Selular dalam Sistem Maklumat Geografi (GIS)
Oleh Shahabuddin Amerudin Automata selular adalah model matematik yang digunakan untuk memodelkan sistem yang terdiri daripada entiti individu yang berinteraksi mengikut peraturan mudah tetapi menghas... Read More
Key Traits for Success in GIS Final Year Projects
By Shahabuddin Amerudin A Final Year Project, especially in the field of Geographic Information Systems (GIS), is a crucial milestone that demands a blend of technical expertise, critical thinking, an... Read More
Assessing Your Readiness for GIS Undergraduate Studies: A Review of the GIS Interest and Qualification Quiz
By Shahabuddin Amerudin Are you considering a future in Geographic Information Systems (GIS) and contemplating pursuing your undergraduate studies at Universiti Teknologi Malaysia (UTM)? The GIS Inter... Read More
Unlock Your GIS Potential with the GIS Postgraduate Quiz – Developed Just for You!
By Shahabuddin Amerudin Are you ready to take your passion for Geographic Information Systems (GIS) to the next level? Look no further than the GIS Postgraduate Quiz, a powerful tool developed specifi... Read More
Assess Your GIS Early Career Potential with the GIS Career Assessment Quiz
By Shahabuddin Amerudin Introduction Are you considering a career in Geographic Information Systems (GIS) or looking to evaluate your potential in this exciting field? Look no further! The GIS Career ... Read More
Geospatial Analysis and 4D-GIS in Mineral Exploration
By Shahabuddin Amerudin Abstract Mineral exploration, a complex and high-stakes endeavor rife with uncertainties, is experiencing a paradigm shift through the integration of cutting-edge geospatial an... Read More
Unraveling the Power of Multi-Dimensional GIS
By Shahabuddin Amerudin Introduction Geographic Information Systems (GIS) have undergone a remarkable transformation since their inception, revolutionizing the way we perceive and interact with spatia... Read More
The Marriage of Cartography and Geographic Information Systems (GIS) Study
In today’s data-driven world, the fusion of technology, data analysis, and spatial understanding has revolutionized how we perceive and interact with our surroundings. This transformation is epi... Read More
A Guide for School Students Interested in Pursuing a GIS Program
By Shahabuddin Amerudin Are you a high school student with a keen interest in geography, maps, and technology? Do you find yourself drawn to the idea of using spatial data to solve real-world problems... Read More
A Guide for Foundation Students Considering a Career in GIS
By Shahabuddin Amerudin Are you a foundation student contemplating your academic journey and intrigued by the world of Geographic Information Systems (GIS)? If you’re passionate about geography,... Read More
Navigating Your GIS Career: Paths to Becoming a GIS Analyst, Developer, Manager, Consultant, or Specialist
By Shahabuddin Amerudin If you’re a GIS (Geographic Information Systems) student with a passion for mapping, spatial data, and problem-solving, you’ve embarked on a journey with exciting p... Read More
Exploring the Relationship Between Question Difficulty and Student Performance in GIS Software System Examinations
By Shahabuddin Amerudin Abstract This paper investigates the intriguing relationship between question difficulty and student performance in GIS Software System examinations. Utilizing data from 33 stu... Read More
Exploring the Quantum Frontier: Quantum Computing’s Transformative Potential in Geographic Information Systems (GIS)
By Shahabuddin Amerudin Introduction In the ever-evolving landscape of computing, quantum technology stands out as a promising frontier that has the potential to reshape how we approach complex proble... Read More
From Quantum GIS to QGIS: The Evolution of a Geospatial Powerhouse
By Shahabuddin Amerudin Introduction In the world of Geographic Information Systems (GIS), QGIS stands tall as an open-source software solution renowned for its versatility, user-friendliness, and pow... Read More
Navigating the Digital Frontier: A Bright Future for Geoinformatics Graduates
By Shahabuddin Amerudin In an age where data is king, and technology continues to shape the way we interact with our world, there’s a field of study that’s becoming increasingly vital and ... Read More
Balancing Programming Education in Geoinformatics: Striking the Right Chord for Student Success
By Shahabuddin Amerudin Abstract This article delves into a pressing issue within the realm of Geoinformatics education at UTM, namely, the divergence between the comprehensive programming curriculum ... Read More
The Decline in Enrollment in GIS Master’s Programs: Unraveling the Complex Challenges
By Shahabuddin Amerudin Abstract This article delves into a pressing issue that has been plaguing GIS (Geographic Information Systems) Master’s programs in recent years, with a particular focus ... Read More
