
Category: Teaching

The Origins of Surveying in Malaysia: A Historical Overview
By Shahabuddin Amerudin Early Beginnings (1832-1880s) Establishment of State Survey Departments (1885 onwards) The need for accurate surveys to support land registration led to: Early Datums and Grid ... Read More
The Future of GIS and the Evolution of Emerging Concepts and Terminology
By Shahabuddin Amerudin Introduction For decades, Geographic Information Systems (GIS) have been the cornerstone of mapping, spatial analysis, and decision-making across a multitude of industries. Tra... Read More
NVIDIA DGX Spark: A Compact AI Supercomputer
By Shahabuddin Amerudin 1. Introduction The launch of NVIDIA DGX Spark on March 18, 2025, marks a significant milestone in AI computing, bringing supercomputer-grade performance to the desktop. ... Read More
Running Local LLMs: Apple Silicon vs. AWS Cloud vs. Windows/Linux Setup
By Shahabuddin Amerudin When deciding how to run large language models (LLMs) locally like DeepSeek R1 70B, LLaMA3 70B, or Qwen2.5 72B, you have three primary options: using Apple Silicon hardware (e.... Read More
Choosing the Best Mac for AI/ML, GeoAI, and Local LLM Inference
By Shahabuddin Amerudin 1. Introduction Selecting the right computer for AI/ML, GeoAI development, and local LLM inference is a crucial decision that impacts long-term productivity, efficiency, and sc... Read More
Advancing Modern GIS Software Systems: Key Technologies, Innovations, and Future Directions
By Shahabuddin Amerudin Introduction Geographic Information System (GIS) software has evolved significantly over the past few decades, driven by advancements in computing, data science, and decision s... Read More
Impact of Modern SDSS on GIS Software Systems
By Shahabuddin Amerudin The evolution of Spatial Decision Support Systems (SDSS) has profoundly influenced the development, architecture, and functionality of Geographic Information System (GIS) softw... Read More
The Evolution of Spatial Decision Support Systems in Modern GIS Environments
By Shahabuddin Amerudin Spatial Decision Support Systems (SDSS) have undergone significant transformation in recent years, evolving from basic mapping tools into sophisticated decision engines that in... Read More
The Evolving Landscape of GIS Software in 2025
By Shahabuddin Amerudin Geographic Information Systems have come a long way from their origins as specialized mapping tools used primarily by government agencies and academic researchers. Today’... Read More
Trends and Challenges Shaping the Future of GIS Software
By Shahabuddin Amerudin Geographic Information System (GIS) software has undergone significant transformation in recent years, driven by rapid advancements in technology. The increasing integration of... Read More
The Evolution and Impact of GIS Software Systems in the Modern World
By Shahabuddin Amerudin Geographic Information Systems (GIS) have become an indispensable tool in today’s data-driven world. By enabling the analysis, visualization, and interpretation of spatial da... Read More
The Changing World of GIS Software Development
Technology moves fast, and if you work in software development, you have to move with it. Samad’s story is a perfect example of what happens when you resist change—and how you can turn things arou... Read More
Why GIS Software Systems Course is Essential for BSc Geoinformatics at UTM
By Shahabuddin Amerudin If you’re a student in the BSc Geoinformatics program at Universiti Teknologi Malaysia, you’ve probably realised by now that GIS Software Systems isn’t just anot... Read More
Development of a Web-Based Application for Managing Student Final Year Projects Repository
By Shahabuddin Amerudin Introduction In today’s digital age, managing and accessing academic data efficiently is crucial for educational institutions. This article provides a comprehensive overview ... Read More
Analysis of End-Course Feedback for GIS Training Camp 2 (Semester 1, Session 2024/2025)
By Dr. Shahabuddin Amerudin Introduction The GIS Training Camp 2 (SBEG3452) was designed to provide students with hands-on experience in GIS applications, field data collection, and spatial analysis w... Read More
Open-Ended Analysis of End-Course Feedback for GIS Training Camp 2 (Semester 1, Session 2024/2025)
By Dr. Shahabuddin Amerudin Introduction The GIS Training Camp 2 (SBEG3542) was conducted over a three-week period from February 17 to March 7, 2025, involving 52 students organized into 13 groups. Th... Read More
Analysis of Mid-Training Feedback for GIS Training Camp 2 (Semester 1, Session 2024/2025)
Prepared by Dr. Shahabuddin Amerudin The GIS Training Camp 2 (SBEG3542) serves as an integral part of the curriculum, providing students with practical exposure to geospatial technologies and real-wor... Read More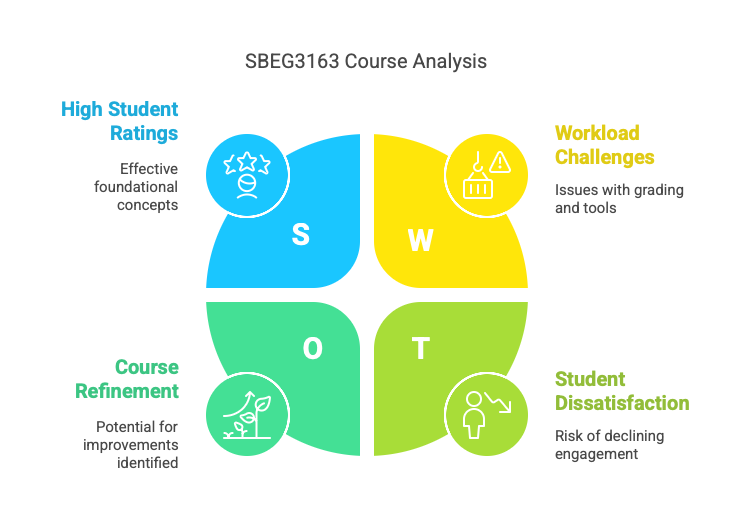
SBEG3163 System Analysis and Design (Semester 1 Session 2024/2025): End-of-Course Feedback Analysis Report
Prepared by Dr. Shahabuddin Amerudin The SBEG3163 System Analysis and Design course has garnered largely positive feedback from students, reflecting its effectiveness in delivering foundational concep... Read More