View

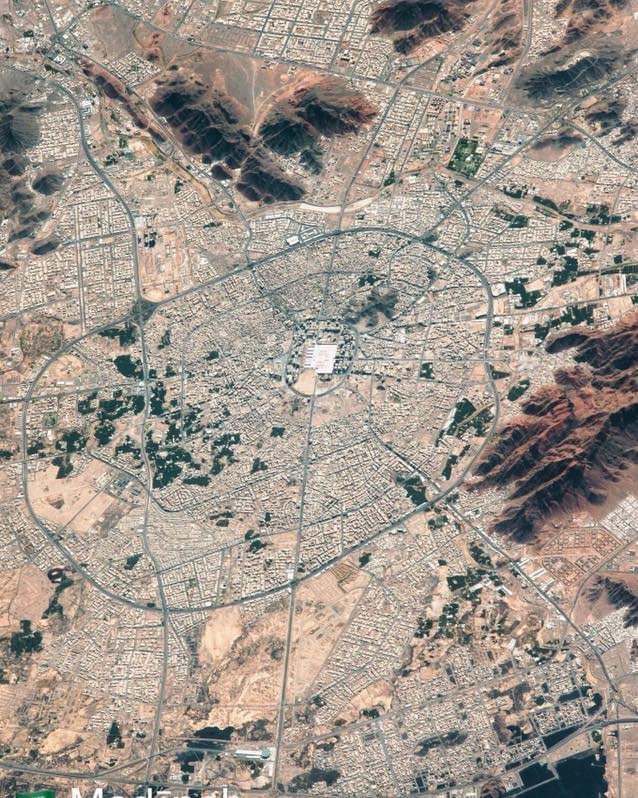
Campus Under Siege! Can You Defend UTM Johor Bahru in “Team Dr. Shah vs Invader”?
View
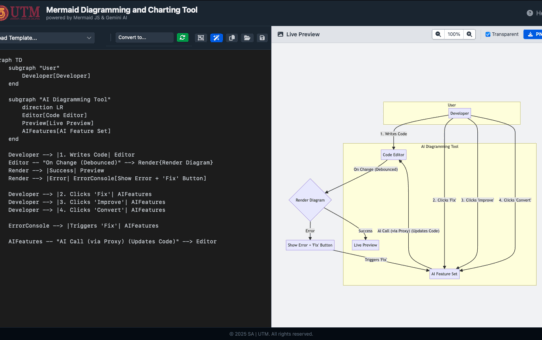
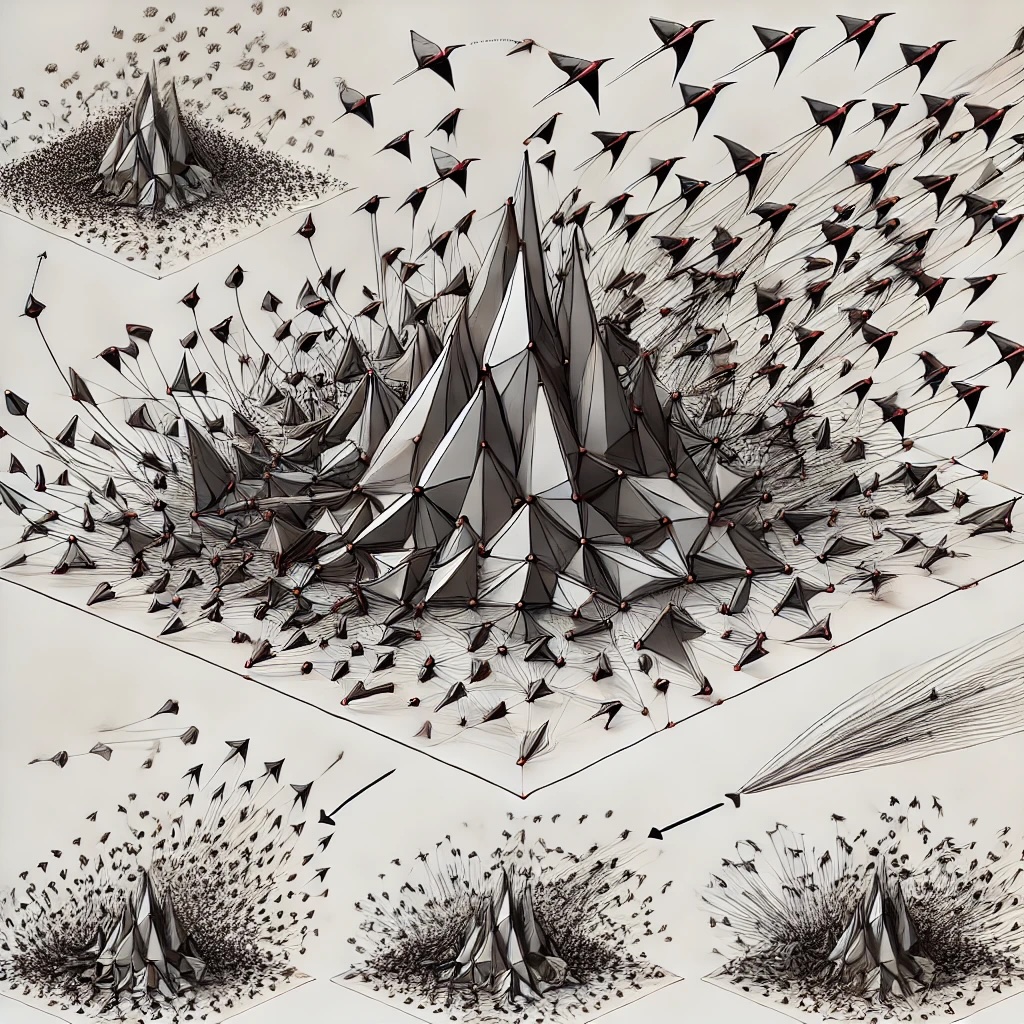
That “Parse Error” Feeling: Why We Gave Our Diagram Tool an AI Brain
View

Visualize Your Mount Ophir Adventure: Introducing the Ultimate Hiking Analyzer
View

The Making of the “Kalkulator Musafir & Waktu Solat” Web App
View

Malaysian Coordinate Transformation & Projection
View

Tesis Yang Tak Pernah Siap-Siap
View
Bila Tesis Tak Lagi Bergerak
View

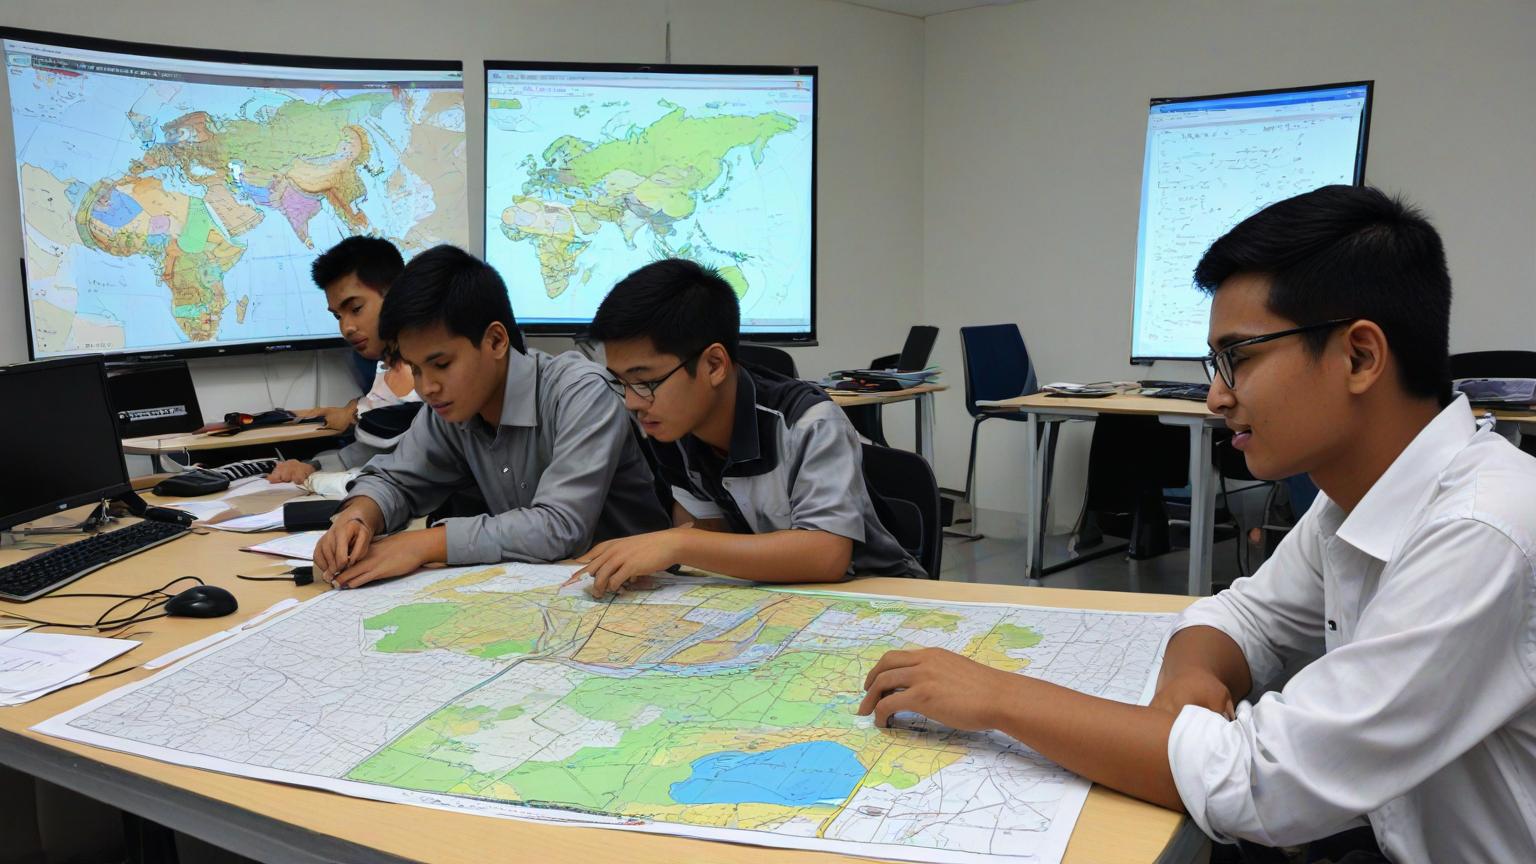
The Evolving Landscape of GIS Software Systems: From Command Lines to the Cloud, AI & Beyond
View

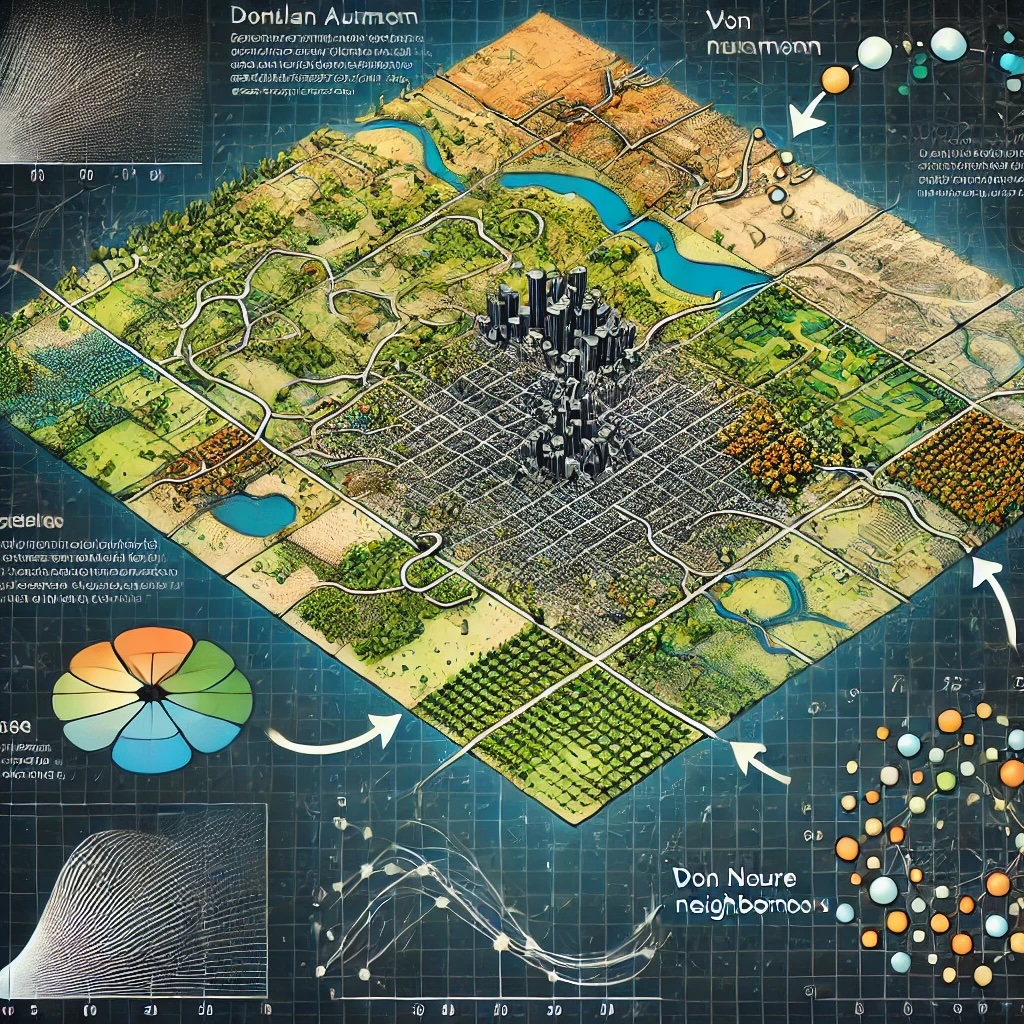
The Future of Geographic Information Systems
View

Sejarah dan Evolusi Sistem Koordinat di Malaysia