
Tag: GIS


Demystifying Key Terminologies in Modern GIS Deployment and Performance
By Shahabuddin Amerudin The field of Geoinformatics is rapidly evolving, driven by advancements in data acquisition, processing power, and software systems. For today’s GIS professionals and stu... Read More
Cross-Platform Development Frameworks and Tools for GIS Applications
By Shahabuddin Amerudin Introduction The increasing complexity and ubiquity of Geographic Information Systems (GIS) necessitate the adoption of flexible, scalable, and cross-platform development appro... Read More
GIS Software Customisation and Development: A Comprehensive Overview
By Shahabuddin Amerudin Introduction Geographic Information Systems (GIS) have become indispensable tools for organizations across various sectors, transforming raw geographic data into valuable insig... Read More
Evolution of the Geospatial Industry
The YouTube video provides an in-depth overview of the development and transformation of the geospatial industry over time. It traces the origins of Geographic Information Systems (GIS), highlighting... Read More
The Evolving Landscape of GIS Software Systems: From Command Lines to the Cloud, AI & Beyond
By Shahabuddin Amerudin Geographic Information System (GIS) software serves as the foundational technology for capturing, storing, manipulating, analyzing, managing, and presenting all types of spatia... Read More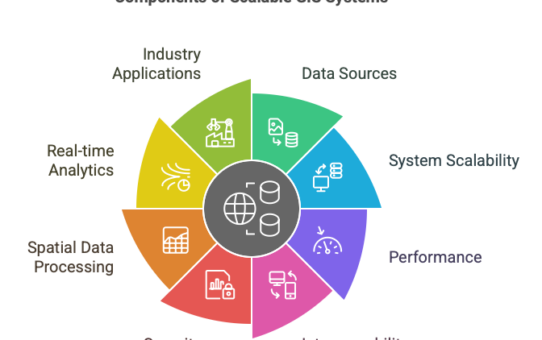
Scalable GIS System Architecture
By Shahabuddin Amerudin Introduction Geographic Information Systems (GIS) have undergone a profound transformation from static cartographic platforms to dynamic, high-throughput geospatial intelligenc... Read More
Theoretical Framework for AI and Predictive GIS in Pipeline Disaster Prevention
By Shahabuddin Amerudin The increasing frequency and severity of pipeline-related disasters, exemplified by the catastrophic 2025 Putra Heights gas explosion, highlight critical shortcomings in conven... Read More
The Future of Geographic Information Systems
By Shahabuddin Amerudin Introduction Geographic Information Systems (GIS) have been a cornerstone of spatial analysis and decision-making for decades, fundamentally transforming how organizations unde... Read More
Migrasi Data GIS: Transformasi dari Cassini dan RSO Lama ke Sistem GDM2000 dan WGS84
1. Keperluan Transformasi Sistem Koordinat GIS Sistem koordinat yang digunakan dalam pangkalan data GIS di Malaysia telah mengalami perubahan ketara dari era Cassini-Soldner (lama) dan RSO (lama)... Read More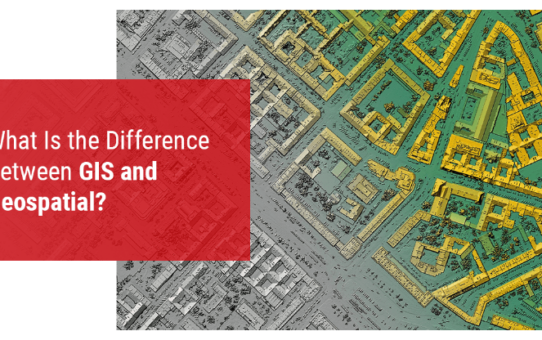
Understanding Geospatial and GIS
By Shahabuddin Amerudin Introduction Geospatial and Geographic Information Systems (GIS) are often used interchangeably, leading to misconceptions regarding their scope and application. While both c... Read More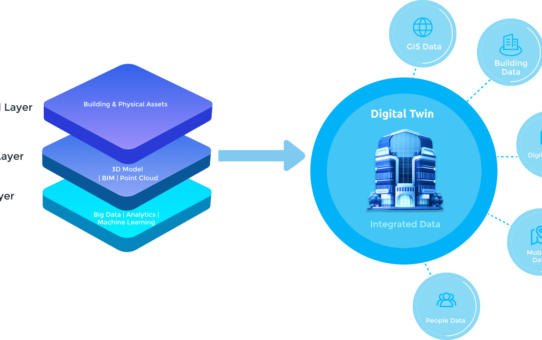
Advancing Digital Twins and GIS Integration
By Shahabuddin Amerudin In the 2021 article “Why Accenture lists ‘digital twins’ as top-five technology trend in 2021,” George Lawton (2021) explores the rising prominence of d... Read More
The Future of GIS and the Evolution of Emerging Concepts and Terminology
By Shahabuddin Amerudin Introduction For decades, Geographic Information Systems (GIS) have been the cornerstone of mapping, spatial analysis, and decision-making across a multitude of industries. Tra... Read More
Advancing Modern GIS Software Systems: Key Technologies, Innovations, and Future Directions
By Shahabuddin Amerudin Introduction Geographic Information System (GIS) software has evolved significantly over the past few decades, driven by advancements in computing, data science, and decision s... Read More
Impact of Modern SDSS on GIS Software Systems
By Shahabuddin Amerudin The evolution of Spatial Decision Support Systems (SDSS) has profoundly influenced the development, architecture, and functionality of Geographic Information System (GIS) softw... Read More
The Evolution of Spatial Decision Support Systems in Modern GIS Environments
By Shahabuddin Amerudin Spatial Decision Support Systems (SDSS) have undergone significant transformation in recent years, evolving from basic mapping tools into sophisticated decision engines that in... Read More
The Evolving Landscape of GIS Software in 2025
By Shahabuddin Amerudin Geographic Information Systems have come a long way from their origins as specialized mapping tools used primarily by government agencies and academic researchers. Today’... Read More
Trends and Challenges Shaping the Future of GIS Software
By Shahabuddin Amerudin Geographic Information System (GIS) software has undergone significant transformation in recent years, driven by rapid advancements in technology. The increasing integration of... Read More
